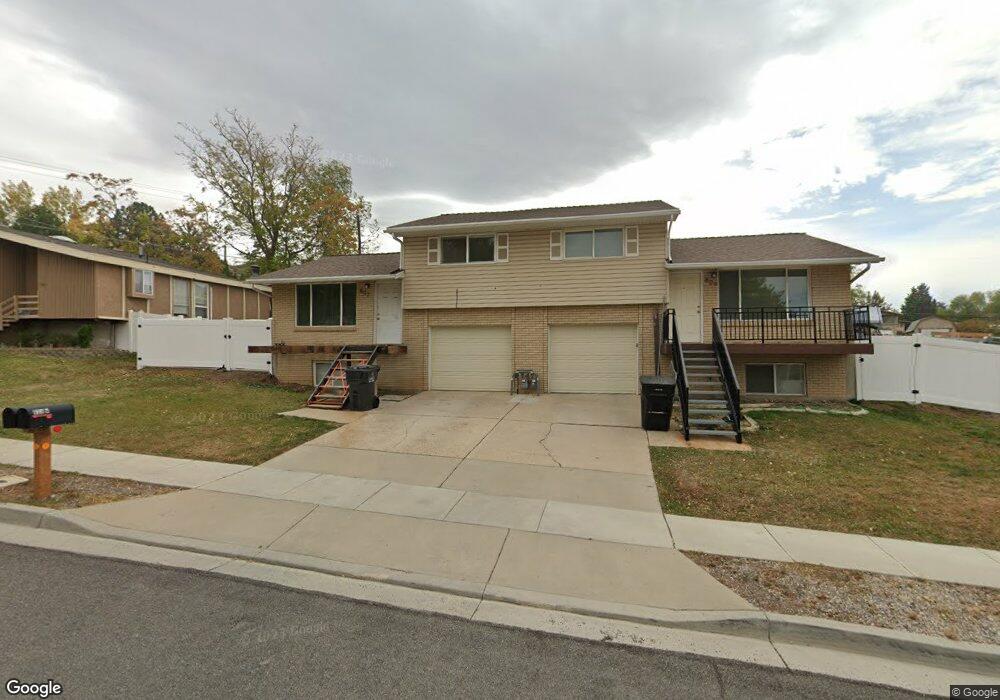
807 W 4050 S Bountiful, UT 84010
Estimated Value: $599,000 - $654,000
6
Beds
2
Baths
2,628
Sq Ft
$242/Sq Ft
Est. Value
About This Home
This home is located at 807 W 4050 S, Bountiful, UT 84010 and is currently estimated at $635,362, approximately $241 per square foot. 807 W 4050 S is a home located in Davis County with nearby schools including Adelaide School, South Davis Junior High School, and Woods Cross High School.
Ownership History
Date
Name
Owned For
Owner Type
Purchase Details
Closed on
May 22, 2013
Sold by
Clift Michael
Bought by
Taylor James G and Taylor Pamela J
Current Estimated Value
Home Financials for this Owner
Home Financials are based on the most recent Mortgage that was taken out on this home.
Original Mortgage
$217,500
Outstanding Balance
$153,637
Interest Rate
3.41%
Mortgage Type
VA
Estimated Equity
$481,725
Purchase Details
Closed on
Feb 28, 2005
Sold by
Warnock Brent and Warnock Kathie
Bought by
Clift Michael
Home Financials for this Owner
Home Financials are based on the most recent Mortgage that was taken out on this home.
Original Mortgage
$196,417
Interest Rate
5.66%
Mortgage Type
FHA
Purchase Details
Closed on
Sep 26, 1996
Sold by
Andrew John C and Andrew Kelly
Bought by
Warnock Brent and Warnock Kathie
Home Financials for this Owner
Home Financials are based on the most recent Mortgage that was taken out on this home.
Original Mortgage
$128,000
Interest Rate
7.87%
Create a Home Valuation Report for This Property
The Home Valuation Report is an in-depth analysis detailing your home's value as well as a comparison with similar homes in the area
Home Values in the Area
Average Home Value in this Area
Purchase History
| Date | Buyer | Sale Price | Title Company |
|---|---|---|---|
| Taylor James G | -- | Integrated Title Ins | |
| Clift Michael | -- | None Available | |
| Warnock Brent | -- | Bonneville Title Company Inc |
Source: Public Records
Mortgage History
| Date | Status | Borrower | Loan Amount |
|---|---|---|---|
| Open | Taylor James G | $217,500 | |
| Previous Owner | Clift Michael | $196,417 | |
| Previous Owner | Warnock Brent | $128,000 |
Source: Public Records
Tax History Compared to Growth
Tax History
| Year | Tax Paid | Tax Assessment Tax Assessment Total Assessment is a certain percentage of the fair market value that is determined by local assessors to be the total taxable value of land and additions on the property. | Land | Improvement |
|---|---|---|---|---|
| 2025 | $1,792 | $350,350 | $163,357 | $186,993 |
| 2024 | $1,625 | $322,850 | $156,069 | $166,781 |
| 2023 | $1,548 | $548,000 | $232,008 | $315,992 |
| 2022 | $1,548 | $315,150 | $110,330 | $204,820 |
| 2021 | $2,715 | $419,000 | $144,291 | $274,709 |
| 2020 | $2,439 | $370,000 | $124,015 | $245,985 |
| 2019 | $2,479 | $364,000 | $136,245 | $227,755 |
| 2018 | $2,212 | $326,000 | $133,676 | $192,324 |
| 2016 | $1,665 | $132,110 | $38,353 | $93,757 |
| 2015 | $1,695 | $127,765 | $38,353 | $89,412 |
| 2014 | $1,920 | $147,781 | $38,353 | $109,428 |
| 2013 | -- | $112,083 | $32,757 | $79,326 |
Source: Public Records
Map
Nearby Homes
- 246 N Glenwood Way
- 2420 S Orchard Dr
- 93 N Valley View Dr
- 252 E Kirsten Ln
- 189 E 210 N Unit 8
- 178 N Valley View Dr
- 284 N 100 E
- 3573 S Highway 89
- 310 N 675 E
- 638 Scenic Hills Dr
- 520 Lacey Way
- 70 E North Town Ln
- 410 N 175 E
- 683 Hillside Oak Cir
- 585 Marialana Way
- 72 S 130 E
- 90 Scenic Hills Cir
- 562 Lancelot Dr Unit 60
- 151 S Bernice Way
- 626 Sagramore St
- 4082 S Orchard Dr
- 787 W 4050 S
- 837 W 4050 S
- 804 W 4050 S Unit 806
- 818 W 4050 S
- 4092 S Orchard Dr
- 4022 S 775 W
- 808 W 4100 S
- 836 W 4050 S
- 812 W 4100 S
- 3146 S Orchard Dr Unit 2
- 838 W 4050 S
- 158 N Orchard Dr Unit 37
- 3980 S 775 W
- 511 Sider Dr
- 228 N Glenwood Way
- 816 W 4100 S
- 158 N Orchard Dr
- 208 Sycamore Ave
- 848 W 4050 S