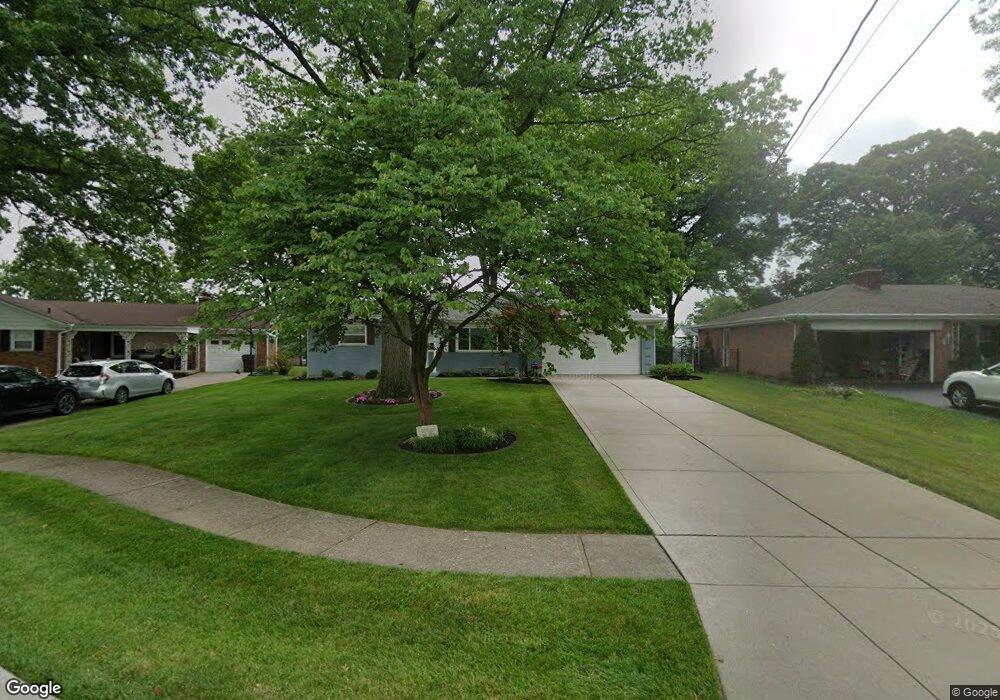
8070 Merrymaker Ln Cincinnati, OH 45236
Estimated Value: $315,257 - $382,000
3
Beds
3
Baths
2,095
Sq Ft
$165/Sq Ft
Est. Value
About This Home
This home is located at 8070 Merrymaker Ln, Cincinnati, OH 45236 and is currently estimated at $345,814, approximately $165 per square foot. 8070 Merrymaker Ln is a home located in Hamilton County with nearby schools including Amity Elementary School, Deer Park Jr/Sr High School, and St. Vincent Ferrer Catholic School.
Ownership History
Date
Name
Owned For
Owner Type
Purchase Details
Closed on
Jun 19, 2018
Sold by
Lance Robert J and Lance Lynda H
Bought by
Ziesler Lora H and Ziesler Lance Robert
Current Estimated Value
Purchase Details
Closed on
Jun 10, 2004
Sold by
Wyatt Kelly and Harley Sidney D
Bought by
Lance Robert J and Lance Lynda H
Purchase Details
Closed on
May 22, 2000
Sold by
Wyatt Donna
Bought by
Wyatt Kelly
Home Financials for this Owner
Home Financials are based on the most recent Mortgage that was taken out on this home.
Original Mortgage
$71,550
Outstanding Balance
$23,314
Interest Rate
8.18%
Mortgage Type
FHA
Estimated Equity
$322,500
Purchase Details
Closed on
Mar 30, 2000
Sold by
Estate Of Edith W Simone
Bought by
Wyatt Donna
Home Financials for this Owner
Home Financials are based on the most recent Mortgage that was taken out on this home.
Original Mortgage
$71,550
Outstanding Balance
$23,314
Interest Rate
8.18%
Mortgage Type
FHA
Estimated Equity
$322,500
Create a Home Valuation Report for This Property
The Home Valuation Report is an in-depth analysis detailing your home's value as well as a comparison with similar homes in the area
Home Values in the Area
Average Home Value in this Area
Purchase History
| Date | Buyer | Sale Price | Title Company |
|---|---|---|---|
| Ziesler Lora H | -- | None Available | |
| Lance Robert J | $176,900 | -- | |
| Wyatt Kelly | $90,000 | Tri-Star Title Agency Inc | |
| Wyatt Donna | -- | -- |
Source: Public Records
Mortgage History
| Date | Status | Borrower | Loan Amount |
|---|---|---|---|
| Open | Wyatt Kelly | $71,550 |
Source: Public Records
Tax History
| Year | Tax Paid | Tax Assessment Tax Assessment Total Assessment is a certain percentage of the fair market value that is determined by local assessors to be the total taxable value of land and additions on the property. | Land | Improvement |
|---|---|---|---|---|
| 2025 | $4,515 | $82,786 | $12,705 | $70,081 |
| 2024 | $3,928 | $82,786 | $12,705 | $70,081 |
| 2023 | $4,047 | $82,786 | $12,705 | $70,081 |
| 2022 | $3,933 | $63,868 | $8,778 | $55,090 |
| 2021 | $3,839 | $63,868 | $8,778 | $55,090 |
| 2020 | $3,512 | $63,868 | $8,778 | $55,090 |
| 2019 | $3,339 | $56,025 | $7,700 | $48,325 |
| 2018 | $3,397 | $56,025 | $7,700 | $48,325 |
| 2017 | $3,211 | $56,025 | $7,700 | $48,325 |
| 2016 | $3,010 | $52,504 | $7,420 | $45,084 |
| 2015 | $2,773 | $52,504 | $7,420 | $45,084 |
| 2014 | $2,776 | $52,504 | $7,420 | $45,084 |
| 2013 | $2,620 | $49,532 | $7,000 | $42,532 |
Source: Public Records
Map
Nearby Homes
- 8095 Camner Ave
- 34 Wentworth Ln
- 42 Wentworth Ln
- 13 Wentworth Ln
- 4305 Myrtle Ave
- 8459 Vorhees Ln
- 4300 Hegner Ave
- 4304 Kugler Mill Rd
- 7633 Montgomery Rd
- 7633 Montgomery Rd Unit 3
- 5760 Kugler Mill Rd
- 4106 Orchard Ln
- 4453 Beryl Ave
- 7752 Montgomery Rd
- 8677 Shagbark Dr
- 4123 Hoffman Ave
- 8468 Plainfield Rd
- 7905 Plainfield Rd
- 8801 Tudor Ct
- 7800 Hosbrook Rd
- 8054 Merrymaker Ln
- 8086 Merrymaker Ln
- 8040 Merrymaker Ln
- 8089 Frolic Dr
- 8098 Merrymaker Ln
- 8069 Frolic Dr
- 8109 Frolic Dr
- 8024 Merrymaker Ln
- 8049 Frolic Dr
- 8129 Frolic Dr
- 8099 Merrymaker Ln
- 8061 Merrymaker Ln
- 8049 Merrymaker Ln
- 8075 Merrymaker Ln
- 8149 Frolic Dr
- 8029 Frolic Dr
- 8087 Merrymaker Ln
- 8037 Merrymaker Ln
- 4672 Happiness Way
- 8023 Merrymaker Ln
Your Personal Tour Guide
Ask me questions while you tour the home.