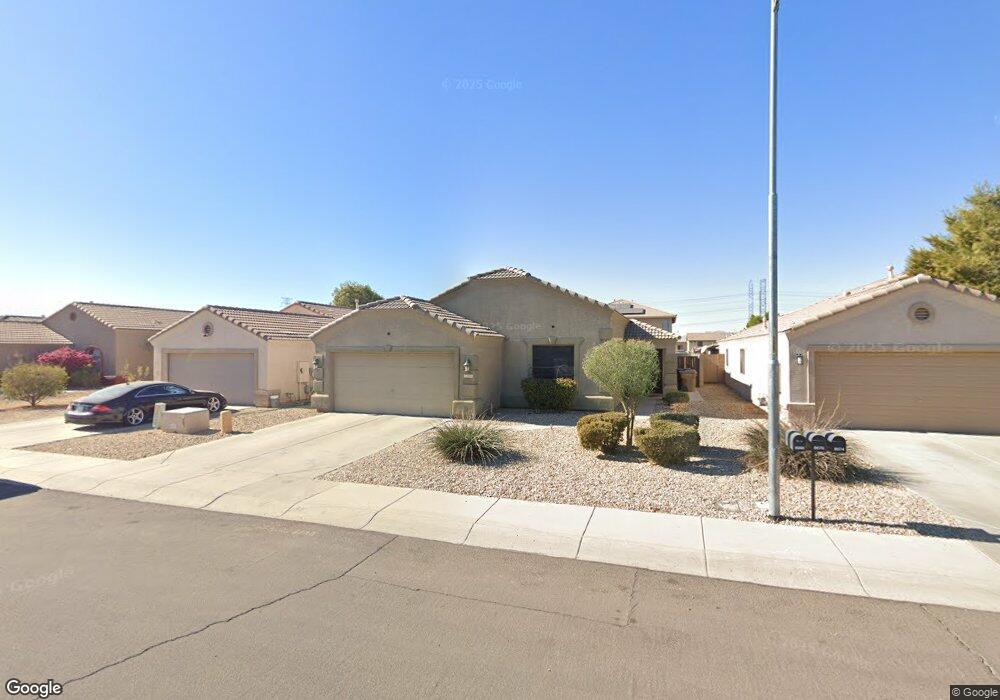
8070 N 109th Ln Peoria, AZ 85345
Estimated Value: $319,298 - $401,000
4
Beds
2
Baths
1,636
Sq Ft
$227/Sq Ft
Est. Value
About This Home
This home is located at 8070 N 109th Ln, Peoria, AZ 85345 and is currently estimated at $371,075, approximately $226 per square foot. 8070 N 109th Ln is a home located in Maricopa County with nearby schools including Country Meadows Elementary School, Raymond S. Kellis, and Heritage Elementary School.
Ownership History
Date
Name
Owned For
Owner Type
Purchase Details
Closed on
Sep 27, 2006
Sold by
Roan Jodi L
Bought by
Roan Frank L and Roan Jodi L
Current Estimated Value
Home Financials for this Owner
Home Financials are based on the most recent Mortgage that was taken out on this home.
Original Mortgage
$115,900
Interest Rate
6.43%
Mortgage Type
Credit Line Revolving
Purchase Details
Closed on
Jun 6, 2003
Sold by
Roan Frank L
Bought by
Roan Jodi L
Home Financials for this Owner
Home Financials are based on the most recent Mortgage that was taken out on this home.
Original Mortgage
$154,000
Interest Rate
5.18%
Mortgage Type
Purchase Money Mortgage
Purchase Details
Closed on
Jun 4, 2003
Sold by
Sonoran View Land Llc
Bought by
Roan Jodi L
Home Financials for this Owner
Home Financials are based on the most recent Mortgage that was taken out on this home.
Original Mortgage
$154,000
Interest Rate
5.18%
Mortgage Type
Purchase Money Mortgage
Create a Home Valuation Report for This Property
The Home Valuation Report is an in-depth analysis detailing your home's value as well as a comparison with similar homes in the area
Home Values in the Area
Average Home Value in this Area
Purchase History
| Date | Buyer | Sale Price | Title Company |
|---|---|---|---|
| Roan Frank L | -- | American Title Svc Agency Ll | |
| Roan Jodi L | -- | Fidelity National Title | |
| Roan Jodi L | $154,013 | Fidelity National Title |
Source: Public Records
Mortgage History
| Date | Status | Borrower | Loan Amount |
|---|---|---|---|
| Closed | Roan Frank L | $115,900 | |
| Closed | Roan Jodi L | $154,000 |
Source: Public Records
Tax History Compared to Growth
Tax History
| Year | Tax Paid | Tax Assessment Tax Assessment Total Assessment is a certain percentage of the fair market value that is determined by local assessors to be the total taxable value of land and additions on the property. | Land | Improvement |
|---|---|---|---|---|
| 2025 | $1,342 | $13,922 | -- | -- |
| 2024 | $1,313 | $13,259 | -- | -- |
| 2023 | $1,313 | $27,310 | $5,460 | $21,850 |
| 2022 | $1,286 | $21,130 | $4,220 | $16,910 |
| 2021 | $1,345 | $19,560 | $3,910 | $15,650 |
| 2020 | $1,354 | $18,000 | $3,600 | $14,400 |
| 2019 | $1,315 | $15,910 | $3,180 | $12,730 |
| 2018 | $1,261 | $14,610 | $2,920 | $11,690 |
| 2017 | $1,260 | $13,660 | $2,730 | $10,930 |
| 2016 | $1,216 | $12,780 | $2,550 | $10,230 |
| 2015 | $1,158 | $12,260 | $2,450 | $9,810 |
Source: Public Records
Map
Nearby Homes
- 11003 W Griswold Rd
- 10815 W Northern Ave Unit 102
- 8140 N 107th Ave Unit 125
- 8140 N 107th Ave Unit 281
- 8140 N 107th Ave Unit 287
- 8101 N 107th Ave Unit 23
- 8131 N 107th Ave Unit 74
- 10620 W Northern Ave Unit 5
- 8161 N 107th Ave Unit 109
- 10719 W Kaler Dr
- 8566 N 108th Ln
- 10516 W Griswold Rd
- 8541 N 112th Ave
- 10512 W Butler Dr
- 8800 N 107th Ave Unit 17
- 8800 N 107th Ave Unit 19
- 10603 W Ruth Ave
- 10625 W Alice Ave
- 8742 N 114th Ave
- 8435 N 104th Dr Unit 3
- 8066 N 109th Ln
- 8074 N 109th Ln
- 8062 N 109th Ln
- 8069 N 110th Ave
- 8065 N 110th Ave
- 8061 N 110th Ave
- 8058 N 109th Ln
- 8069 N 109th Ln
- 8065 N 109th Ln
- 8073 N 109th Ln
- 8073 N 109th Dr
- 10974 W Manzanita Dr
- 8061 N 109th Ln
- 10968 W Manzanita Dr
- 10980 W Manzanita Dr
- 8054 N 109th Ln
- 10962 W Manzanita Dr
- 10986 W Manzanita Dr