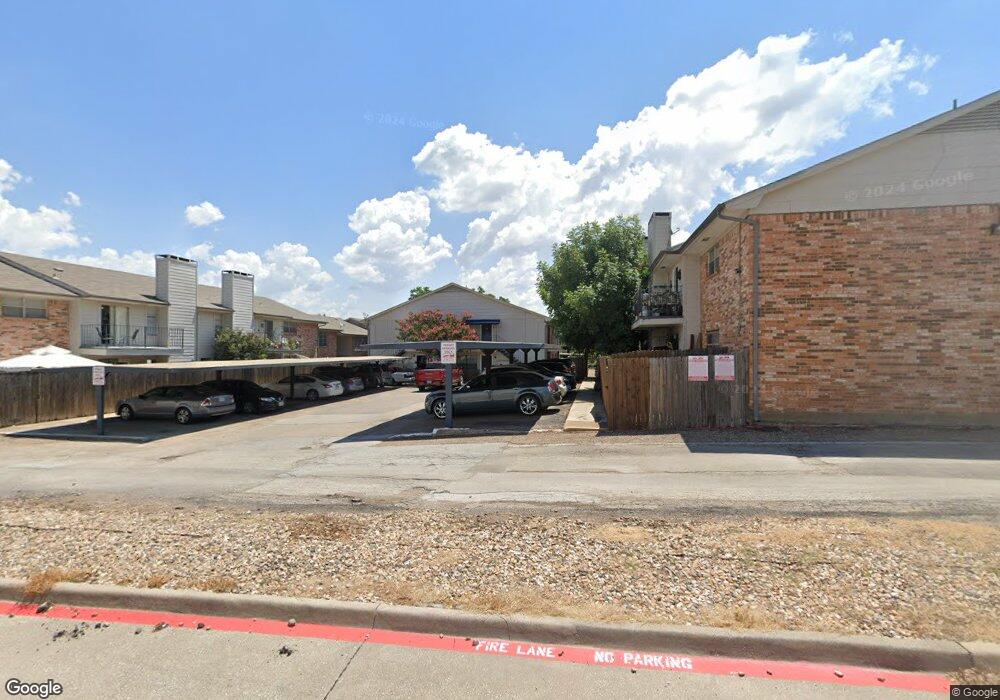
8071 Meadow Rd Unit 218F Dallas, TX 75231
Vickery NeighborhoodEstimated Value: $172,000 - $234,000
2
Beds
2
Baths
1,197
Sq Ft
$172/Sq Ft
Est. Value
About This Home
This home is located at 8071 Meadow Rd Unit 218F, Dallas, TX 75231 and is currently estimated at $206,339, approximately $172 per square foot. 8071 Meadow Rd Unit 218F is a home located in Dallas County with nearby schools including Benjamin Franklin International Exploratory Academy, Hillcrest High School, and Our Redeemer Lutheran School.
Ownership History
Date
Name
Owned For
Owner Type
Purchase Details
Closed on
Jun 7, 2022
Sold by
Genaye Woyinshet T
Bought by
Desanto Alem M
Current Estimated Value
Purchase Details
Closed on
Oct 31, 2018
Sold by
Messeye Abier L
Bought by
Genaye Woyinshet T
Home Financials for this Owner
Home Financials are based on the most recent Mortgage that was taken out on this home.
Original Mortgage
$75,000
Interest Rate
4.6%
Mortgage Type
Purchase Money Mortgage
Purchase Details
Closed on
Nov 3, 2005
Sold by
Ayele Betelehem
Bought by
Messeye Abier
Purchase Details
Closed on
Oct 7, 2003
Sold by
Quiroz Roberto F and Ossaba Quiroz Laksmy
Bought by
Compass Bank
Purchase Details
Closed on
May 31, 2002
Sold by
Willems Dan
Bought by
Quiroz Roberto F
Home Financials for this Owner
Home Financials are based on the most recent Mortgage that was taken out on this home.
Original Mortgage
$50,825
Interest Rate
6.89%
Create a Home Valuation Report for This Property
The Home Valuation Report is an in-depth analysis detailing your home's value as well as a comparison with similar homes in the area
Home Values in the Area
Average Home Value in this Area
Purchase History
| Date | Buyer | Sale Price | Title Company |
|---|---|---|---|
| Desanto Alem M | -- | None Listed On Document | |
| Genaye Woyinshet T | -- | None Available | |
| Messeye Abier | -- | -- | |
| Compass Bank | $35,000 | -- | |
| Quiroz Roberto F | -- | -- |
Source: Public Records
Mortgage History
| Date | Status | Borrower | Loan Amount |
|---|---|---|---|
| Previous Owner | Genaye Woyinshet T | $75,000 | |
| Previous Owner | Quiroz Roberto F | $50,825 |
Source: Public Records
Tax History Compared to Growth
Tax History
| Year | Tax Paid | Tax Assessment Tax Assessment Total Assessment is a certain percentage of the fair market value that is determined by local assessors to be the total taxable value of land and additions on the property. | Land | Improvement |
|---|---|---|---|---|
| 2025 | $4,779 | $213,810 | $62,860 | $150,950 |
| 2024 | $4,779 | $213,810 | $62,860 | $150,950 |
| 2023 | $4,779 | $213,810 | $62,860 | $150,950 |
| 2022 | $4,549 | $181,940 | $62,860 | $119,080 |
| 2021 | $4,800 | $181,940 | $62,860 | $119,080 |
| 2020 | $4,936 | $181,940 | $62,860 | $119,080 |
| 2019 | $5,109 | $179,550 | $62,860 | $116,690 |
| 2018 | $3,092 | $113,720 | $62,860 | $50,860 |
| 2017 | $1,400 | $51,470 | $31,430 | $20,040 |
| 2016 | $1,400 | $51,470 | $31,430 | $20,040 |
| 2015 | $969 | $41,900 | $31,430 | $10,470 |
| 2014 | $969 | $34,710 | $31,430 | $3,280 |
Source: Public Records
Map
Nearby Homes
- 8106 Fallston Ct
- 7859 Verona Place
- 8120 Bromley Dr
- 10238 Regal Oaks Dr
- 10212 Regal Oaks Dr Unit C
- 10224 Regal Oaks Dr Unit D
- 8222 Milroy Ln
- 8238 Hastings Dr
- 7770 Meadow Rd Unit 211
- 7770 Meadow Rd Unit 106
- 8233 Laflin Ln
- 10423 High Hollows Dr Unit 114B
- 8256 Milroy Ln
- 10438 High Hollows Dr Unit 245
- 10437 High Hollows Dr Unit 219C
- 10436 High Hollows Dr Unit 243
- 7860 Minglewood Ln
- 8128 Ardmore Ct
- 10440 High Hollows Dr Unit 146L
- 7880 Minglewood Ln
- 8089 Meadow Rd Unit 230M
- 8065 Meadow Rd Unit 211D
- 8089 Meadow Rd Unit 231
- 8091 Meadow Rd Unit 132N
- 8087 Meadow Rd Unit 229
- 8087 Meadow Rd Unit 129L
- 8091 Meadow Rd Unit 133N
- 8075 Meadow Rd Unit 221
- 8081 Meadow Rd Unit 123H
- 8083 Meadow Rd Unit 125J
- 8063 Meadow Rd Unit 210
- 8071 Meadow Rd Unit 118F
- 8083 Meadow Rd Unit 124J
- 8083 Meadow Rd Unit 224J
- 8083 Meadow Rd Unit 225
- 8067 Meadow Rd Unit 214D
- 8091 Meadow Rd Unit 233
- 8089 Meadow Rd Unit 131M
- 8089 Meadow Rd Unit 130M
- 8087 Meadow Rd Unit 228L