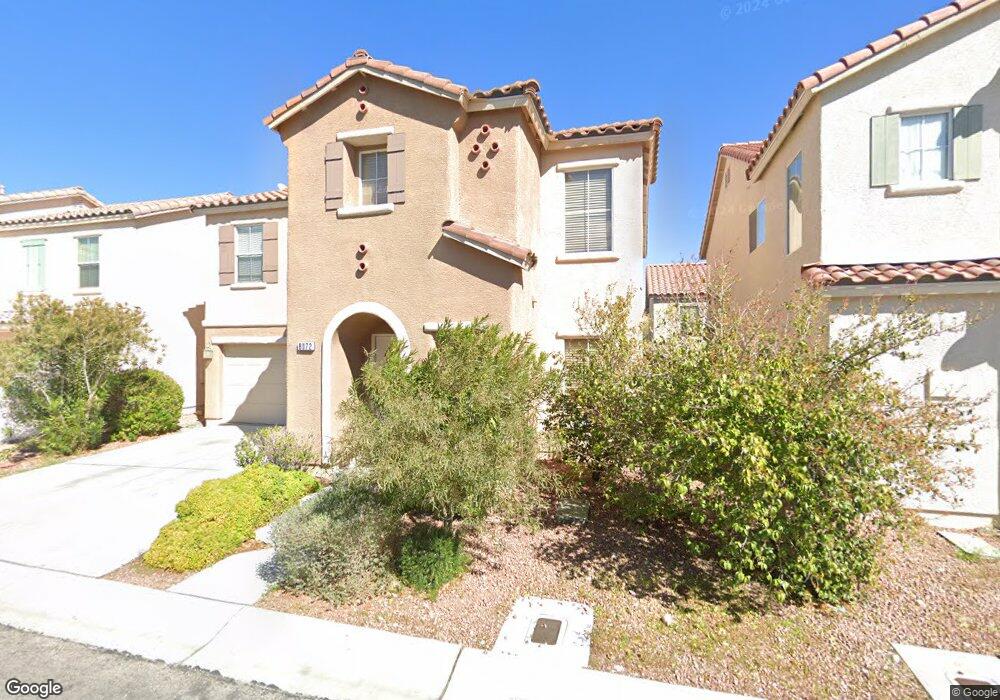
8072 Windmill Villa St Las Vegas, NV 89139
Coronado Ranch NeighborhoodEstimated Value: $414,847 - $429,000
3
Beds
3
Baths
1,851
Sq Ft
$227/Sq Ft
Est. Value
About This Home
This home is located at 8072 Windmill Villa St, Las Vegas, NV 89139 and is currently estimated at $420,712, approximately $227 per square foot. 8072 Windmill Villa St is a home located in Clark County with nearby schools including Lawrence & Heidi Canarelli Middle School, Sierra Vista High School, and Doral Academy West Pebble.
Ownership History
Date
Name
Owned For
Owner Type
Purchase Details
Closed on
Aug 5, 2014
Sold by
Leung & Liang Family Living Trust 201
Bought by
Leung Liang Diamond Series 2 Llc
Current Estimated Value
Purchase Details
Closed on
May 6, 2013
Sold by
Leung Diamond Llc
Bought by
Leung & Liang Family Living Trust 2013
Purchase Details
Closed on
Sep 17, 2012
Sold by
Leung Cun Duck and Liang Irene
Bought by
Leung Diamond Llc
Purchase Details
Closed on
Jun 23, 2010
Sold by
Villalpando Mario A and Villalpando Nancy Y
Bought by
Leung Cun Duck and Liang Yu Yu
Purchase Details
Closed on
Apr 7, 2004
Sold by
Kb Home Nevada Inc
Bought by
Villalpando Mario A and Villalpando Nancy Y
Home Financials for this Owner
Home Financials are based on the most recent Mortgage that was taken out on this home.
Original Mortgage
$154,370
Interest Rate
5.75%
Mortgage Type
Unknown
Create a Home Valuation Report for This Property
The Home Valuation Report is an in-depth analysis detailing your home's value as well as a comparison with similar homes in the area
Home Values in the Area
Average Home Value in this Area
Purchase History
| Date | Buyer | Sale Price | Title Company |
|---|---|---|---|
| Leung Liang Diamond Series 2 Llc | -- | -- | |
| Leung & Liang Family Living Trust 2013 | $134,000 | None Available | |
| Leung Diamond Llc | -- | None Available | |
| Leung Cun Duck | $134,000 | National Title Company | |
| Villalpando Mario A | $192,963 | First American Title Co Of |
Source: Public Records
Mortgage History
| Date | Status | Borrower | Loan Amount |
|---|---|---|---|
| Previous Owner | Villalpando Mario A | $154,370 | |
| Closed | Villalpando Mario A | $38,592 |
Source: Public Records
Tax History Compared to Growth
Tax History
| Year | Tax Paid | Tax Assessment Tax Assessment Total Assessment is a certain percentage of the fair market value that is determined by local assessors to be the total taxable value of land and additions on the property. | Land | Improvement |
|---|---|---|---|---|
| 2025 | $2,152 | $106,061 | $33,250 | $72,811 |
| 2024 | $2,090 | $106,061 | $33,250 | $72,811 |
| 2023 | $2,090 | $100,114 | $31,500 | $68,614 |
| 2022 | $1,936 | $88,226 | $25,550 | $62,676 |
| 2021 | $1,793 | $82,947 | $23,450 | $59,497 |
| 2020 | $1,662 | $82,429 | $23,450 | $58,979 |
| 2019 | $1,557 | $77,886 | $19,950 | $57,936 |
| 2018 | $1,486 | $72,151 | $16,800 | $55,351 |
| 2017 | $2,094 | $71,386 | $15,400 | $55,986 |
| 2016 | $1,392 | $60,570 | $12,250 | $48,320 |
| 2015 | $1,388 | $51,256 | $8,750 | $42,506 |
| 2014 | $1,345 | $44,494 | $5,250 | $39,244 |
Source: Public Records
Map
Nearby Homes
- 7999 Hilltop Windmill St
- 6251 Tuckaway Cove Ave
- 6275 Mount Palomar Ave
- 8231 Annual Ridge St
- 6250 Sierra Knolls Ct
- 5964 Secret Island Dr Unit 3
- 6279 Sierra Knolls Ct
- 6005 Crown Palms Ave
- 5888 Atlantis Dream Ave
- 5934 Banbury Heights Way
- 5897 Atlantis Dream Ave
- 6454 Mount Palomar Ave
- 5865 Azzura Palms Ave
- 7936 Avalon Mist St
- 7884 Millbrookshire Way
- 8312 Langhorne Creek St
- 8032 Imperial Treasure St
- 8177 Amphora St
- 6314 Sharp Rock Ct
- 7819 Harp Tree St
- 8072 Windmill Villa St Unit house
- 8064 Windmill Villa St
- 8080 Windmill Villa St
- 8071 Flower Festival St
- 8079 Flower Festival St
- 8063 Flower Festival St
- 8056 Windmill Villa St
- 8088 Windmill Villa St
- 8073 Windmill Villa St
- 8065 Windmill Villa St
- 8087 Flower Festival St
- 8081 Windmill Villa St
- 8055 Flower Festival St
- 8057 Windmill Villa St
- 8048 Windmill Villa St
- 8047 Flower Festival St Unit 2
- 8049 Windmill Villa St
- 8074 Hilltop Windmill St
- 8066 Hilltop Windmill St
- 8066 Hilltop Windmill St Unit none