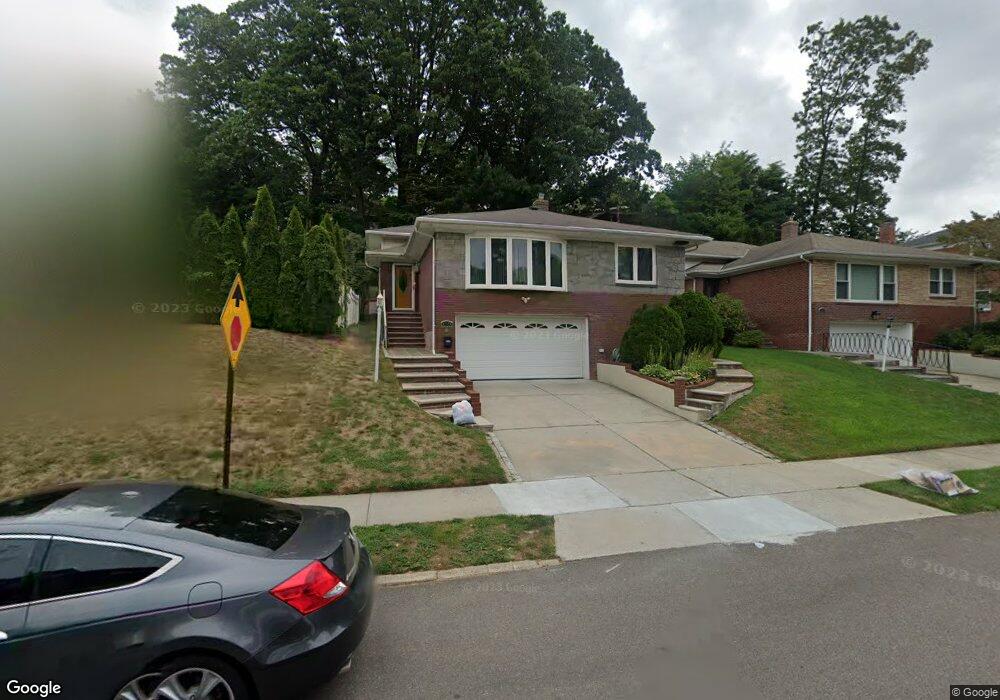
8073 Chevy Chase St Jamaica, NY 11432
Jamaica Estates NeighborhoodEstimated Value: $1,663,610 - $2,160,000
--
Bed
--
Bath
2,281
Sq Ft
$871/Sq Ft
Est. Value
About This Home
This home is located at 8073 Chevy Chase St, Jamaica, NY 11432 and is currently estimated at $1,986,153, approximately $870 per square foot. 8073 Chevy Chase St is a home located in Queens County with nearby schools including P.S. I.S. 178 The Holliswood School, George J. Ryan Middle School 216, and Holy Family School.
Ownership History
Date
Name
Owned For
Owner Type
Purchase Details
Closed on
Aug 12, 2020
Sold by
Poon Eric Sin-Kam
Bought by
Annie F Poon Revocable Trust and Annie Foo Poon Trustee
Current Estimated Value
Purchase Details
Closed on
Mar 4, 2016
Sold by
Zhang Alice P and Zhang David Y
Bought by
Poon Eric Sin-Kam
Purchase Details
Closed on
Aug 22, 1997
Sold by
Ferber Clara
Bought by
Zhang Alice P and Zhang David Y
Home Financials for this Owner
Home Financials are based on the most recent Mortgage that was taken out on this home.
Original Mortgage
$170,000
Interest Rate
7.47%
Purchase Details
Closed on
Jun 6, 1997
Sold by
Connolly Joyce and Ferber Clara
Bought by
Ferber Clara
Purchase Details
Closed on
Nov 9, 1994
Sold by
Ferber Clara
Bought by
Connolly Joyce and Ferber Clara
Create a Home Valuation Report for This Property
The Home Valuation Report is an in-depth analysis detailing your home's value as well as a comparison with similar homes in the area
Home Values in the Area
Average Home Value in this Area
Purchase History
| Date | Buyer | Sale Price | Title Company |
|---|---|---|---|
| Annie F Poon Revocable Trust | -- | -- | |
| Annie F Poon Revocable Trust | -- | -- | |
| Poon Eric Sin-Kam | $1,388,000 | -- | |
| Poon Eric Sin-Kam | $1,388,000 | -- | |
| Poon Eric Sin-Kam | $1,388,000 | -- | |
| Zhang Alice P | $415,000 | -- | |
| Zhang Alice P | $415,000 | -- | |
| Ferber Clara | -- | -- | |
| Ferber Clara | -- | -- | |
| Connolly Joyce | -- | American Title Ins Co | |
| Connolly Joyce | -- | American Title Ins Co |
Source: Public Records
Mortgage History
| Date | Status | Borrower | Loan Amount |
|---|---|---|---|
| Previous Owner | Zhang Alice P | $170,000 |
Source: Public Records
Tax History Compared to Growth
Tax History
| Year | Tax Paid | Tax Assessment Tax Assessment Total Assessment is a certain percentage of the fair market value that is determined by local assessors to be the total taxable value of land and additions on the property. | Land | Improvement |
|---|---|---|---|---|
| 2025 | $14,789 | $78,050 | $21,587 | $56,463 |
| 2024 | $14,789 | $73,632 | $24,399 | $49,233 |
| 2023 | $13,952 | $69,466 | $19,574 | $49,892 |
| 2022 | $13,710 | $97,860 | $27,000 | $70,860 |
| 2021 | $13,864 | $96,480 | $27,000 | $69,480 |
| 2020 | $13,767 | $82,980 | $27,000 | $55,980 |
| 2019 | $12,836 | $79,140 | $27,000 | $52,140 |
| 2018 | $11,503 | $57,888 | $17,413 | $40,475 |
| 2017 | $11,367 | $57,230 | $20,853 | $36,377 |
| 2016 | $10,665 | $57,230 | $20,853 | $36,377 |
| 2015 | $6,292 | $54,202 | $29,781 | $24,421 |
| 2014 | $6,292 | $51,134 | $29,320 | $21,814 |
Source: Public Records
Map
Nearby Homes
- 81-22 Haddon St
- 184-46 Aberdeen Rd
- 18547 80th Rd
- 186-35 80th Dr
- 8012 188th St
- 75-56 184th St
- 80-47 188th St
- 67 182nd St
- 80-50 189th St
- 75-22 186th St
- 18631 Radnor Rd
- 186-31 Radnor Rd
- 80-48 190th St
- 179-04 80th Dr
- 75-84 180th St
- 80-11 190th St
- 181-30 Tudor Rd
- 81-48 192nd St
- 8515 Kent St
- 7516 180th St
- 80-73 Chevy Chase St Unit ST
- 8079 Chevy Chase St
- 8065 Chevy Chase St
- 80-65 Chevy Chase St
- 8020 Haddon St
- 8085 Chevy Chase St
- 18508 80th Dr
- 8028 Haddon St
- 8066 Chevy Chase St
- 18512 80th Dr
- 8091 Chevy Chase St
- 8010 Haddon St
- 8080 Chevy Chase St
- 8088 Chevy Chase St
- 80-88 Chevy Chase St
- 81-07 Chevy Chase St
- 8110 Haddon St
- 18258 80th Dr
- 18461 Tudor Rd
- 18461 Tudor Rd