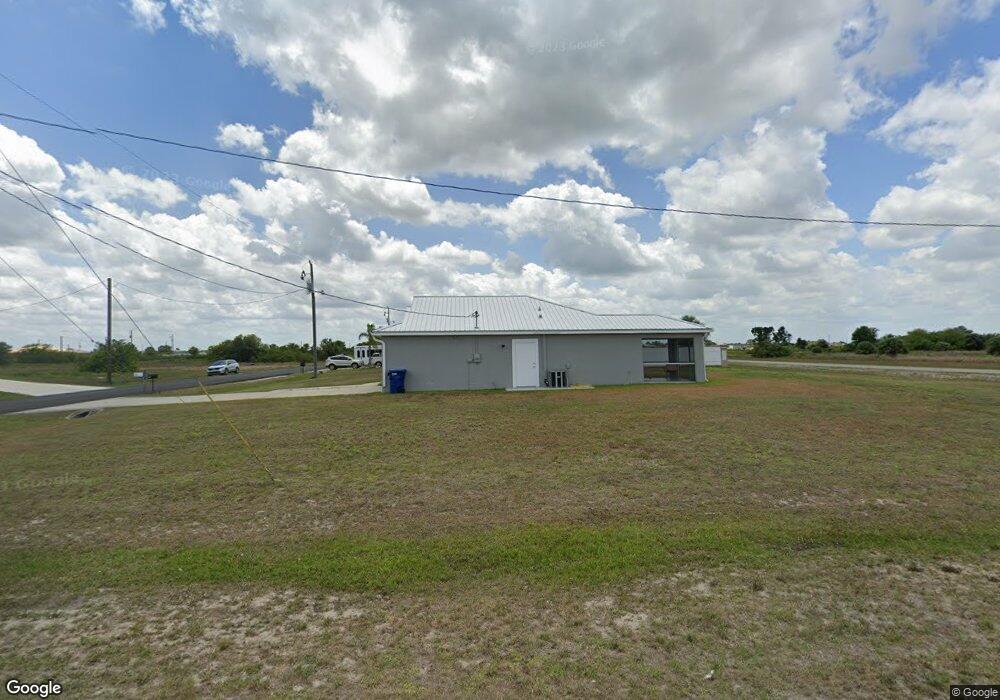
8075 Marsh Cir Labelle, FL 33935
Port LaBelle NeighborhoodEstimated Value: $273,120 - $436,000
4
Beds
2
Baths
1,707
Sq Ft
$195/Sq Ft
Est. Value
About This Home
This home is located at 8075 Marsh Cir, Labelle, FL 33935 and is currently estimated at $332,780, approximately $194 per square foot. 8075 Marsh Cir is a home located in Hendry County with nearby schools including Rcma-Mira Verde Coc and International Christian Academy of Labelle.
Ownership History
Date
Name
Owned For
Owner Type
Purchase Details
Closed on
Dec 31, 2012
Sold by
Zanardi Marcelo and Zanardi Monica
Bought by
Mmz Holdings Llc
Current Estimated Value
Purchase Details
Closed on
Sep 27, 2011
Sold by
Vanarsdale Richard
Bought by
Zanardi Marcelo and Zanardi Monica
Purchase Details
Closed on
Feb 14, 2011
Sold by
Suntrust Mortgage Inc
Bought by
Vanarsdale Richard
Purchase Details
Closed on
Sep 22, 2010
Sold by
Dubin Gary R and Sabti Moshe
Bought by
Suntrust Mortgage Inc
Purchase Details
Closed on
Jun 14, 2007
Sold by
Sabti Moshe and Sagal Madre
Bought by
Sabti Moshe and Dubin Gary R
Purchase Details
Closed on
May 30, 2001
Sold by
Linaras Vivian and Linaras Vivian Helen
Bought by
Moshe Sabti & Madre Sagal Land Of Fl
Purchase Details
Closed on
May 16, 1997
Sold by
Saigh Donald R
Bought by
Linaras Vivian
Create a Home Valuation Report for This Property
The Home Valuation Report is an in-depth analysis detailing your home's value as well as a comparison with similar homes in the area
Home Values in the Area
Average Home Value in this Area
Purchase History
| Date | Buyer | Sale Price | Title Company |
|---|---|---|---|
| Mmz Holdings Llc | $55,000 | Everglades Abstract & Title | |
| Zanardi Marcelo | $55,000 | Boston Natl Title Agency Llc | |
| Vanarsdale Richard | $37,900 | Boston National Title Agency | |
| Suntrust Mortgage Inc | -- | None Available | |
| Sabti Moshe | -- | -- | |
| Moshe Sabti & Madre Sagal Land Of Fl | $5,300 | -- | |
| Linaras Vivian | -- | -- |
Source: Public Records
Tax History
| Year | Tax Paid | Tax Assessment Tax Assessment Total Assessment is a certain percentage of the fair market value that is determined by local assessors to be the total taxable value of land and additions on the property. | Land | Improvement |
|---|---|---|---|---|
| 2025 | $5,048 | $240,159 | $20,200 | $219,959 |
| 2024 | $4,523 | $238,890 | $17,100 | $221,790 |
| 2023 | $4,523 | $248,493 | $17,900 | $230,593 |
| 2022 | $4,240 | $206,354 | $17,900 | $188,454 |
| 2021 | $3,880 | $180,442 | $7,000 | $173,442 |
| 2020 | $3,721 | $166,667 | $5,800 | $160,867 |
| 2019 | $3,593 | $157,252 | $5,100 | $152,152 |
| 2018 | $3,217 | $124,832 | $4,100 | $120,732 |
| 2017 | $3,116 | $109,858 | $0 | $0 |
| 2016 | $2,725 | $97,230 | $0 | $0 |
| 2015 | $2,483 | $85,920 | $0 | $0 |
| 2014 | $2,298 | $82,380 | $0 | $0 |
Source: Public Records
Map
Nearby Homes
- 8015 Marsh Cir
- 8002 Mill Ct
- 8018 Marsh Cir
- 8007 Mangrove Cir
- 8013 Mangrove Cir
- 8003 Mangrove Cir
- 8031 Melody Cir
- 8106 Olive Ct
- 8031 Memory Cir
- 8010 Memory Cir
- 8109 Olive Ct
- 8004 Olive Cir
- 9026 Maywood Cir
- 8308 Lena Ct
- 8050 Salem Cir
- 8304 Lena Ct
- 9032 Maywood Cir
- 9013 Maywood Cir
- 9047 Maywood Cir
- 9020 N Indio Cir
- 8073 Marsh Cir
- 8071 Marsh Cir
- 8074 Marsh Cir
- 8074 Marsh Cir
- 5028 Melody Cir
- 8069 Marsh Cir
- 8002 Marsh Cir
- 8004 Marsh Cir
- 8005 Melody Cir
- 8005 Mill Ct
- 8054 Marsh Cir
- 8015 Marsh Cir Unit 13
- 8104 Salt Ct
- 8104 Salt Ct Unit 7
- 8039 Marsh Cir
- 8065 Marsh Cir
- 8021 Marsh Cir
- 8027 Marsh Cir
- 8003 Marsh Cir
- 8005 Marsh Cir
Your Personal Tour Guide
Ask me questions while you tour the home.