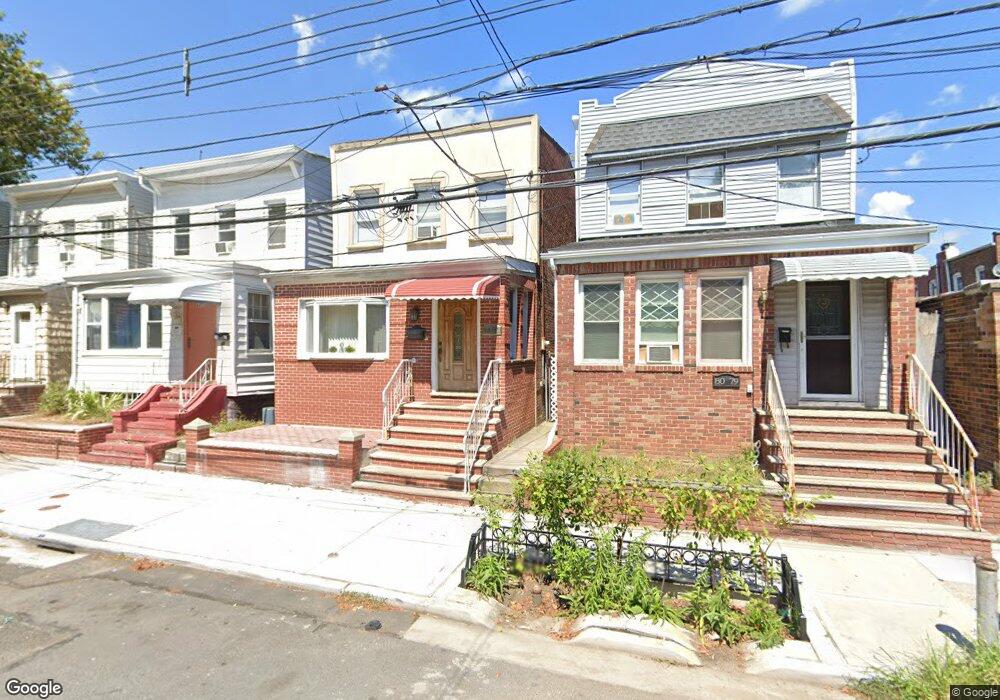
8077 88th Rd Woodhaven, NY 11421
Woodhaven NeighborhoodEstimated Value: $607,000 - $773,000
--
Bed
--
Bath
1,434
Sq Ft
$475/Sq Ft
Est. Value
About This Home
This home is located at 8077 88th Rd, Woodhaven, NY 11421 and is currently estimated at $681,267, approximately $475 per square foot. 8077 88th Rd is a home located in Queens County with nearby schools including P.S. 060 Woodhaven, Jhs 210 Elizabeth Blackwell, and St. Thomas the Apostle Catholic Academy.
Ownership History
Date
Name
Owned For
Owner Type
Purchase Details
Closed on
Jan 31, 2023
Sold by
Roces Andrea and Roces Ramon
Bought by
Yousef Ashraf H
Current Estimated Value
Home Financials for this Owner
Home Financials are based on the most recent Mortgage that was taken out on this home.
Original Mortgage
$482,000
Outstanding Balance
$466,712
Interest Rate
6.27%
Mortgage Type
Purchase Money Mortgage
Estimated Equity
$214,555
Purchase Details
Closed on
May 30, 1998
Sold by
Better Homes Depot Inc
Bought by
Roces Ramon and Roces Andrea
Home Financials for this Owner
Home Financials are based on the most recent Mortgage that was taken out on this home.
Original Mortgage
$173,467
Interest Rate
6.99%
Mortgage Type
FHA
Purchase Details
Closed on
Mar 9, 1998
Sold by
Napolitan Paul and Spinelli Anita Rita
Bought by
Better Home Depot Inc
Create a Home Valuation Report for This Property
The Home Valuation Report is an in-depth analysis detailing your home's value as well as a comparison with similar homes in the area
Home Values in the Area
Average Home Value in this Area
Purchase History
| Date | Buyer | Sale Price | Title Company |
|---|---|---|---|
| Yousef Ashraf H | $625,000 | -- | |
| Roces Ramon | $181,000 | -- | |
| Better Home Depot Inc | $90,000 | Lawyers Title Insurance Corp |
Source: Public Records
Mortgage History
| Date | Status | Borrower | Loan Amount |
|---|---|---|---|
| Open | Yousef Ashraf H | $482,000 | |
| Previous Owner | Roces Ramon | $173,467 |
Source: Public Records
Tax History Compared to Growth
Tax History
| Year | Tax Paid | Tax Assessment Tax Assessment Total Assessment is a certain percentage of the fair market value that is determined by local assessors to be the total taxable value of land and additions on the property. | Land | Improvement |
|---|---|---|---|---|
| 2025 | $5,699 | $30,025 | $9,793 | $20,232 |
| 2024 | $5,699 | $28,373 | $8,692 | $19,681 |
| 2023 | $5,597 | $27,868 | $8,600 | $19,268 |
| 2022 | $5,120 | $41,400 | $12,720 | $28,680 |
| 2021 | $5,284 | $37,260 | $12,720 | $24,540 |
| 2020 | $5,000 | $35,160 | $12,720 | $22,440 |
| 2019 | $4,653 | $37,020 | $12,720 | $24,300 |
| 2018 | $4,436 | $23,223 | $9,846 | $13,377 |
| 2017 | $4,302 | $22,572 | $9,420 | $13,152 |
| 2016 | $4,107 | $22,572 | $9,420 | $13,152 |
| 2015 | $2,349 | $20,851 | $12,395 | $8,456 |
| 2014 | $2,349 | $19,704 | $14,049 | $5,655 |
Source: Public Records
Map
Nearby Homes