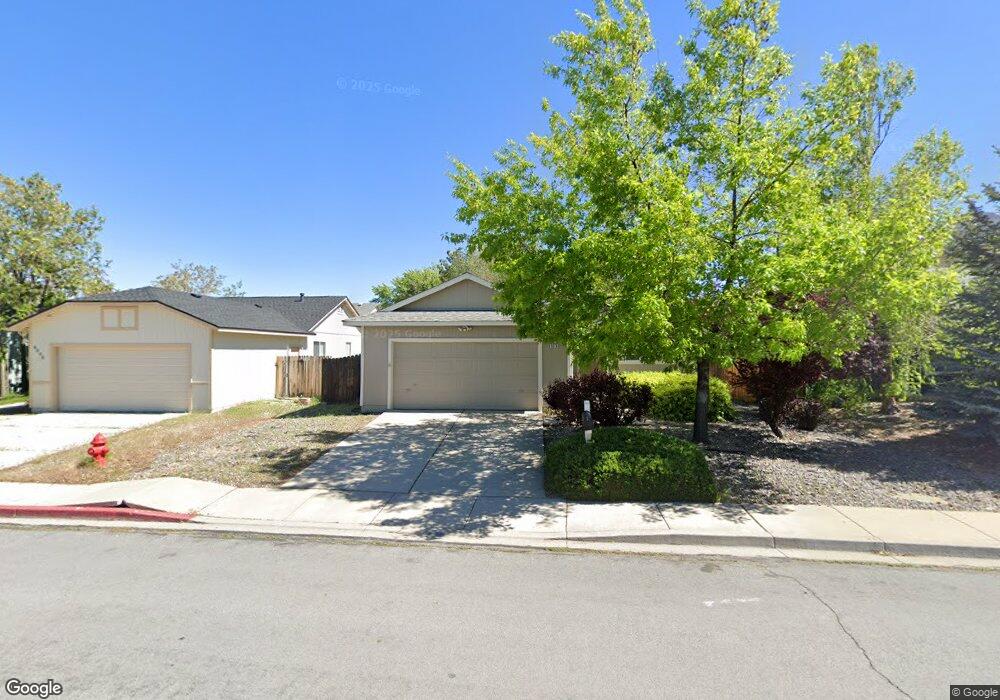
8078 Anchor Point Dr Reno, NV 89506
Stead NeighborhoodEstimated Value: $397,464 - $422,000
3
Beds
2
Baths
1,318
Sq Ft
$314/Sq Ft
Est. Value
About This Home
This home is located at 8078 Anchor Point Dr, Reno, NV 89506 and is currently estimated at $413,616, approximately $313 per square foot. 8078 Anchor Point Dr is a home located in Washoe County with nearby schools including Silver Lake Elementary School, Cold Springs Middle School, and North Valleys High School.
Ownership History
Date
Name
Owned For
Owner Type
Purchase Details
Closed on
Feb 4, 2013
Sold by
Belaustegui Toni
Bought by
Belausgegui Toni S and Toni S Belaustegui Living Trust
Current Estimated Value
Purchase Details
Closed on
Oct 5, 2001
Sold by
Grisillo Glenn
Bought by
Belaustegui Toni
Purchase Details
Closed on
Mar 20, 1998
Sold by
Grisillo Glenn H and Belaustegui Toni D
Bought by
Grisillo Glenn H and Belaustegui Toni D
Home Financials for this Owner
Home Financials are based on the most recent Mortgage that was taken out on this home.
Original Mortgage
$97,500
Interest Rate
7.06%
Purchase Details
Closed on
Aug 6, 1996
Sold by
Lewis Homes Of Nevada
Bought by
Grisillo Glenn H and Belaustegui Toni D
Home Financials for this Owner
Home Financials are based on the most recent Mortgage that was taken out on this home.
Original Mortgage
$94,900
Interest Rate
8.33%
Create a Home Valuation Report for This Property
The Home Valuation Report is an in-depth analysis detailing your home's value as well as a comparison with similar homes in the area
Home Values in the Area
Average Home Value in this Area
Purchase History
| Date | Buyer | Sale Price | Title Company |
|---|---|---|---|
| Belausgegui Toni S | -- | None Available | |
| Belaustegui Toni | -- | -- | |
| Belaustegui Toni | -- | -- | |
| Grisillo Glenn H | -- | Founders Title Co | |
| Grisillo Glenn H | $119,000 | Stewart Title |
Source: Public Records
Mortgage History
| Date | Status | Borrower | Loan Amount |
|---|---|---|---|
| Previous Owner | Grisillo Glenn H | $97,500 | |
| Previous Owner | Grisillo Glenn H | $94,900 |
Source: Public Records
Tax History
| Year | Tax Paid | Tax Assessment Tax Assessment Total Assessment is a certain percentage of the fair market value that is determined by local assessors to be the total taxable value of land and additions on the property. | Land | Improvement |
|---|---|---|---|---|
| 2026 | $1,638 | $76,456 | $32,725 | $43,731 |
| 2024 | $1,518 | $74,208 | $28,980 | $45,228 |
| 2023 | $1,474 | $70,798 | $27,790 | $43,008 |
| 2022 | $1,431 | $60,338 | $24,360 | $35,978 |
| 2021 | $1,369 | $55,057 | $19,075 | $35,982 |
| 2020 | $1,311 | $54,647 | $18,480 | $36,167 |
| 2019 | $1,249 | $53,293 | $18,235 | $35,058 |
| 2018 | $1,204 | $47,023 | $12,915 | $34,108 |
| 2017 | $1,168 | $46,287 | $12,040 | $34,247 |
| 2016 | $1,138 | $45,767 | $10,675 | $35,092 |
| 2015 | $288 | $44,092 | $8,960 | $35,132 |
| 2014 | $1,104 | $39,374 | $7,175 | $32,199 |
| 2013 | -- | $29,898 | $5,250 | $24,648 |
Source: Public Records
Map
Nearby Homes
- 7973 Moss Creek Dr
- 7871 Anchor Point Ct
- 8451 Seal Beach Dr
- 8655 Silver Shores Dr
- 7975 Monterey Shores Dr
- 8000 Monterey Shores Dr
- 8651 Beechcraft Dr
- 7690 E Key Largo Ct
- 8455 Red Baron Blvd
- 9500 N Red Rock Rd
- 7497 Hebrides Ct
- Red Rock 19.82 Acres
- 8821 Sunset Breeze Dr
- 8944 Red Baron Blvd
- 8925 Silverkist Dr
- 9906 N Virginia St
- 0 Duffney Ln
- 7100 Peppermint Dr
- 6769 Peppermint Ct
- 6764 Honeysuckle Ct
- 8088 Anchor Point Dr
- 8068 Anchor Point Dr
- 8098 Anchor Point Dr
- 8058 Anchor Point Dr
- 8071 Big River Dr
- 8061 Big River Dr
- 8081 Big River Dr
- 8051 Big River Dr
- 8091 Big River Dr
- 8108 Anchor Point Dr Unit 16
- 8087 Anchor Point Dr
- 8048 Anchor Point Dr
- 8077 Anchor Point Dr
- 8041 Big River Dr Unit 17
- 8097 Anchor Point Dr Unit 16
- 8067 Anchor Point Dr Unit 16
- 8101 Big River Dr
- 8107 Anchor Point Dr
- 8031 Big River Dr
- 8118 Anchor Point Dr
Your Personal Tour Guide
Ask me questions while you tour the home.