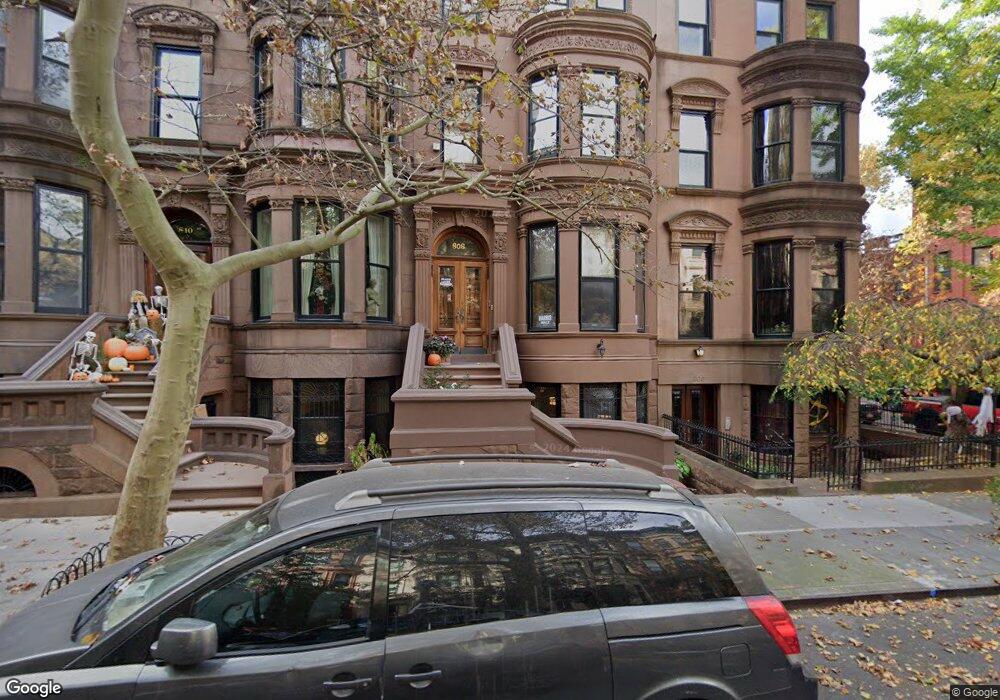
808 Carroll St Unit 2 Brooklyn, NY 11215
Park Slope NeighborhoodEstimated Value: $4,575,000 - $6,362,412
--
Bed
1
Bath
5,080
Sq Ft
$1,114/Sq Ft
Est. Value
About This Home
This home is located at 808 Carroll St Unit 2, Brooklyn, NY 11215 and is currently estimated at $5,656,804, approximately $1,113 per square foot. 808 Carroll St Unit 2 is a home located in Kings County with nearby schools including P.S. 321 William Penn, Berkeley Carroll Elementary School, and Berkeley Carroll School.
Ownership History
Date
Name
Owned For
Owner Type
Purchase Details
Closed on
Aug 12, 2010
Sold by
Welch John G and Welch Nelly M
Bought by
Welch John G and Welch Nelly M
Current Estimated Value
Purchase Details
Closed on
Sep 6, 2000
Sold by
Welch John G
Bought by
Welch John G and Welch Nelly M
Create a Home Valuation Report for This Property
The Home Valuation Report is an in-depth analysis detailing your home's value as well as a comparison with similar homes in the area
Home Values in the Area
Average Home Value in this Area
Purchase History
| Date | Buyer | Sale Price | Title Company |
|---|---|---|---|
| Welch John G | -- | -- | |
| Welch John G | -- | -- | |
| Welch John G | -- | Commonwealth Land Title Ins | |
| Welch John G | -- | Commonwealth Land Title Ins |
Source: Public Records
Tax History Compared to Growth
Tax History
| Year | Tax Paid | Tax Assessment Tax Assessment Total Assessment is a certain percentage of the fair market value that is determined by local assessors to be the total taxable value of land and additions on the property. | Land | Improvement |
|---|---|---|---|---|
| 2025 | $14,966 | $368,940 | $49,800 | $319,140 |
| 2024 | $14,966 | $322,320 | $49,800 | $272,520 |
| 2023 | $15,053 | $332,340 | $49,800 | $282,540 |
| 2022 | $10,448 | $291,480 | $49,800 | $241,680 |
| 2021 | $13,927 | $301,380 | $49,800 | $251,580 |
| 2020 | $6,514 | $339,480 | $49,800 | $289,680 |
| 2019 | $12,889 | $375,420 | $49,800 | $325,620 |
| 2018 | $12,196 | $64,166 | $11,207 | $52,959 |
| 2017 | $11,691 | $60,553 | $10,750 | $49,803 |
| 2016 | $10,844 | $57,547 | $10,932 | $46,615 |
| 2015 | $6,465 | $54,292 | $13,281 | $41,011 |
| 2014 | $6,465 | $53,745 | $12,590 | $41,155 |
Source: Public Records
Map
Nearby Homes
- 130 8th Ave Unit 6E
- 130 8th Ave Unit 7D
- 783 Carroll St
- 118 8th Ave Unit 8D
- 118 8th Ave Unit 2D
- 19 Fiske Place Unit C1
- 140 8th Ave Unit 6J
- 140 8th Ave Unit 5H
- 140 8th Ave Unit 2C
- 23 Fiske Place Unit 3
- 123 8th Ave
- 846 President St Unit 5R
- 784 Carroll St Unit 1
- 10 Montgomery Place Unit 4A
- 757 Carroll St
- 90 8th Ave Unit 8C
- 90 8th Ave Unit 2E
- 25 Montgomery Place Unit 3
- 78 8th Ave Unit 5J
- 78 8th Ave Unit 4K
- 808 Carroll St
- 810 Carroll St
- 810 Carroll St
- 810 Carroll St Unit Garden
- 806 Carroll St Unit 4
- 806 Carroll St Unit 1
- 806 Carroll St Unit 3
- 806 Carroll St Unit 2
- 812 Carroll St Unit 6
- 812 Carroll St Unit PARLOR
- 812 Carroll St Unit 3F
- 812 Carroll St Unit 2F
- 812 Carroll St Unit 2R
- 812 Carroll St Unit 3R
- 802 Carroll St Unit 5
- 802 Carroll St Unit 2R
- 800 Carroll St
- 130 8th Ave Unit 2H
- 130 8th Ave Unit 4A
- 130 8th Ave Unit GS3