808 Chestnut Ave Wilmette, IL 60091
Estimated Value: $1,048,000 - $1,536,000
4
Beds
2
Baths
2,206
Sq Ft
$601/Sq Ft
Est. Value
About This Home
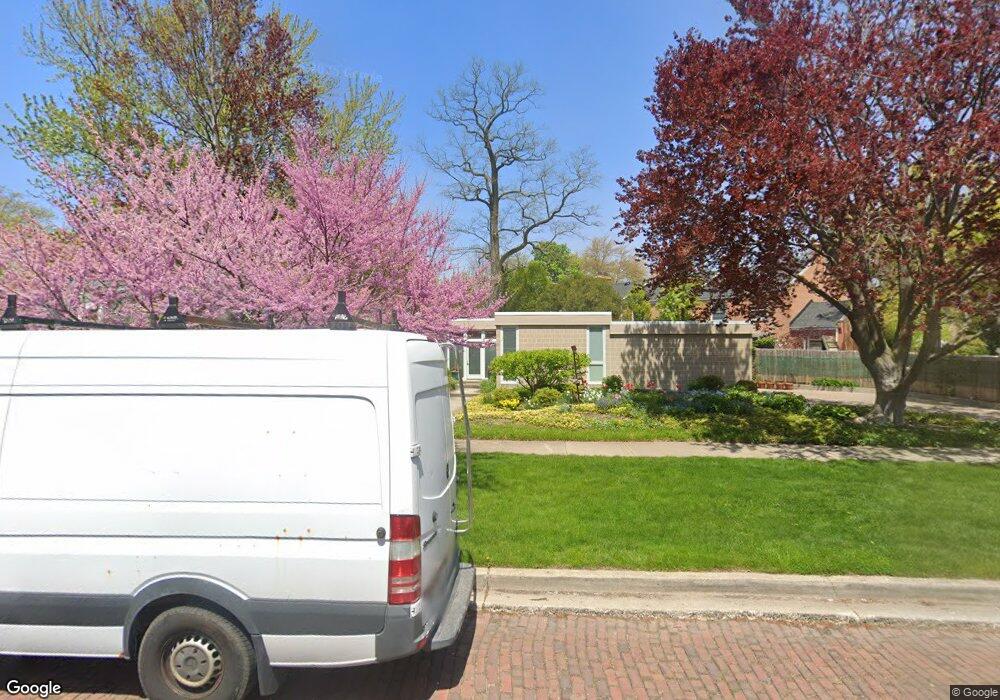
This home is located at 808 Chestnut Ave, Wilmette, IL 60091 and is currently estimated at $1,326,311, approximately $601 per square foot. 808 Chestnut Ave is a home located in Cook County with nearby schools including Central Elementary School, Highcrest Middle School, and Wilmette Junior High School.
Ownership History
Date
Name
Owned For
Owner Type
Purchase Details
Closed on
Feb 28, 2013
Sold by
Lindsay Dean and Lindsay Carla
Bought by
Lindsay Carla A and Carla A Lindsay Trust
Current Estimated Value
Purchase Details
Closed on
Mar 2, 2001
Sold by
Karchmer Kurt E
Bought by
Lindsay Dean and Lindsay Carla
Purchase Details
Closed on
Nov 25, 1997
Sold by
Bowers Norman D and Bowers Mary W
Bought by
Karchmer Kurt E
Home Financials for this Owner
Home Financials are based on the most recent Mortgage that was taken out on this home.
Original Mortgage
$303,750
Interest Rate
7.75%
Purchase Details
Closed on
Sep 13, 1996
Sold by
Bowers Mary W and Bowers Norman D
Bought by
Bowers Norman D and Bowers Mary W
Purchase Details
Closed on
Oct 4, 1994
Sold by
Bowers Norman D and Bowers Mary W
Bought by
Mary W Bowers Revocable Trust
Create a Home Valuation Report for This Property
The Home Valuation Report is an in-depth analysis detailing your home's value as well as a comparison with similar homes in the area
Home Values in the Area
Average Home Value in this Area
Purchase History
| Date | Buyer | Sale Price | Title Company |
|---|---|---|---|
| Lindsay Carla A | -- | None Available | |
| Lindsay Dean | $520,000 | Chicago Title Insurance Co | |
| Karchmer Kurt E | $405,000 | -- | |
| Bowers Norman D | -- | -- | |
| Mary W Bowers Revocable Trust | -- | -- |
Source: Public Records
Mortgage History
| Date | Status | Borrower | Loan Amount |
|---|---|---|---|
| Previous Owner | Karchmer Kurt E | $303,750 |
Source: Public Records
Tax History
| Year | Tax Paid | Tax Assessment Tax Assessment Total Assessment is a certain percentage of the fair market value that is determined by local assessors to be the total taxable value of land and additions on the property. | Land | Improvement |
|---|---|---|---|---|
| 2025 | $17,242 | $110,000 | $24,895 | $85,105 |
| 2024 | $17,242 | $81,951 | $21,065 | $60,886 |
| 2023 | $17,149 | $86,003 | $21,065 | $64,938 |
| 2022 | $17,149 | $86,003 | $21,065 | $64,938 |
| 2021 | $10,935 | $48,086 | $18,384 | $29,702 |
| 2020 | $10,861 | $48,086 | $18,384 | $29,702 |
| 2019 | $10,515 | $52,268 | $18,384 | $33,884 |
| 2018 | $15,635 | $71,904 | $15,320 | $56,584 |
| 2017 | $15,228 | $71,904 | $15,320 | $56,584 |
| 2016 | $16,228 | $78,941 | $15,320 | $63,621 |
| 2015 | $15,028 | $65,032 | $12,639 | $52,393 |
| 2014 | $14,811 | $65,032 | $12,639 | $52,393 |
| 2013 | $14,121 | $65,032 | $12,639 | $52,393 |
Source: Public Records
Map
Nearby Homes
- 1403 Sheridan Rd
- 1420 Sheridan Rd Unit 3I
- 1500 Sheridan Rd Unit 1K
- 1500 Sheridan Rd Unit 6H
- 1616 Sheridan Rd Unit 8F
- 925 Ashland Ave
- 1625 Sheridan Rd Unit 204
- 1630 Sheridan Rd Unit 6H
- 121 Robsart Rd
- 829 Elmwood Ave
- 835 Forest Ave
- 145 Oxford Rd
- 123 Oxford Rd
- 260 Oxford Rd
- 1119 Forest Ave
- 1232 Elmwood Ave
- 1029 Lake Ave
- 626 Washington Ave
- 1326 Ashland Ave
- 719 Washington Ave
- 818 Chestnut Ave
- 1427 Sheridan Rd
- 1429 Sheridan Rd
- 1431 Sheridan Rd
- 1433 Sheridan Rd
- 822 Chestnut Ave
- 1435 Sheridan Rd
- 1437 Sheridan Rd
- 806 Chestnut Ave
- 826 Chestnut Ave
- 1417 Sheridan Rd
- 1417 Sheridan Rd Unit 7E
- 1415 Sheridan Rd
- 804 Chestnut Ave
- 1419 Sheridan Rd
- 807 Chestnut Ave
- 1421 Sheridan Rd
- 1425 Sheridan Rd Unit 7A
- 1423 Sheridan Rd
- 823 Chestnut Ave
Your Personal Tour Guide
Ask me questions while you tour the home.