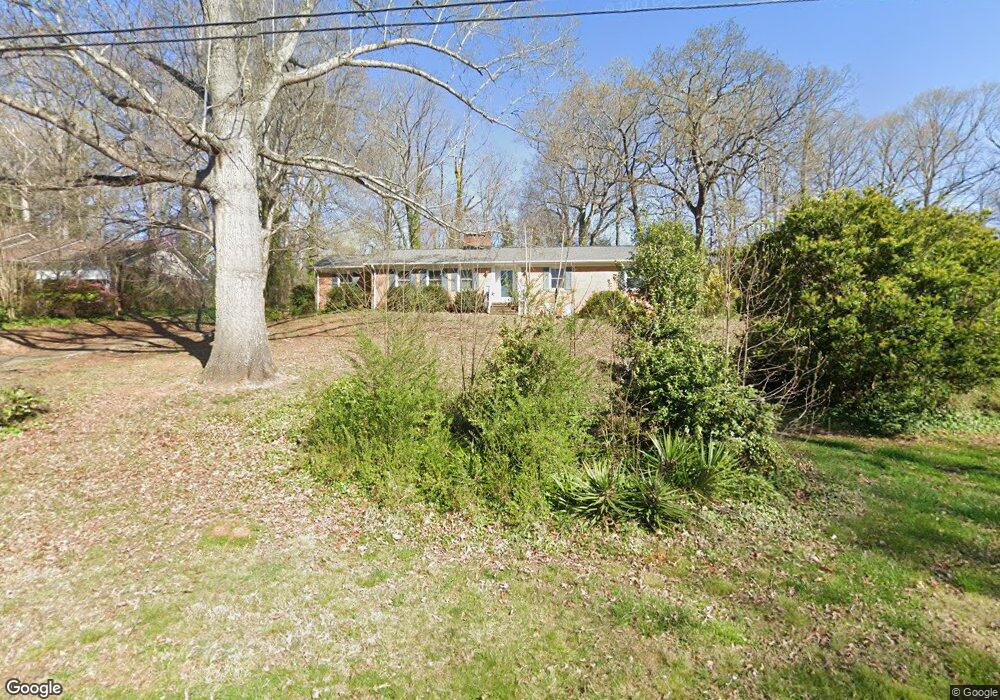
808 Cliftwood Dr Siler City, NC 27344
Estimated Value: $239,000 - $290,000
3
Beds
2
Baths
1,758
Sq Ft
$151/Sq Ft
Est. Value
About This Home
This home is located at 808 Cliftwood Dr, Siler City, NC 27344 and is currently estimated at $266,040, approximately $151 per square foot. 808 Cliftwood Dr is a home located in Chatham County with nearby schools including Siler City Elementary School, Chatham Middle, and Jordan Matthews High.
Ownership History
Date
Name
Owned For
Owner Type
Purchase Details
Closed on
May 19, 2011
Sold by
Myers David Lee and Estate Of David Lester Herrin
Bought by
Washington William R and Washington Katherine P
Current Estimated Value
Home Financials for this Owner
Home Financials are based on the most recent Mortgage that was taken out on this home.
Original Mortgage
$116,062
Outstanding Balance
$80,035
Interest Rate
4.79%
Mortgage Type
New Conventional
Estimated Equity
$186,005
Purchase Details
Closed on
Jul 24, 2008
Sold by
Bank Of New York
Bought by
Herrin David L
Home Financials for this Owner
Home Financials are based on the most recent Mortgage that was taken out on this home.
Original Mortgage
$79,900
Interest Rate
6.61%
Mortgage Type
Purchase Money Mortgage
Create a Home Valuation Report for This Property
The Home Valuation Report is an in-depth analysis detailing your home's value as well as a comparison with similar homes in the area
Home Values in the Area
Average Home Value in this Area
Purchase History
| Date | Buyer | Sale Price | Title Company |
|---|---|---|---|
| Washington William R | $112,000 | None Available | |
| Herrin David L | $100,000 | None Available |
Source: Public Records
Mortgage History
| Date | Status | Borrower | Loan Amount |
|---|---|---|---|
| Open | Washington William R | $116,062 | |
| Previous Owner | Herrin David L | $79,900 |
Source: Public Records
Tax History Compared to Growth
Tax History
| Year | Tax Paid | Tax Assessment Tax Assessment Total Assessment is a certain percentage of the fair market value that is determined by local assessors to be the total taxable value of land and additions on the property. | Land | Improvement |
|---|---|---|---|---|
| 2025 | $2,617 | $207,145 | $36,480 | $170,665 |
| 2024 | $2,617 | $141,890 | $30,400 | $111,490 |
| 2023 | $1,795 | $141,890 | $30,400 | $111,490 |
| 2022 | $1,710 | $141,890 | $30,400 | $111,490 |
| 2021 | $1,710 | $141,890 | $30,400 | $111,490 |
| 2020 | $1,479 | $122,244 | $22,050 | $100,194 |
| 2019 | $1,479 | $122,244 | $22,050 | $100,194 |
| 2018 | $1,391 | $122,244 | $22,050 | $100,194 |
| 2017 | $1,391 | $122,244 | $22,050 | $100,194 |
| 2016 | $1,392 | $125,016 | $22,500 | $102,516 |
| 2015 | $1,378 | $125,016 | $22,500 | $102,516 |
| 2014 | $1,378 | $125,016 | $22,500 | $102,516 |
| 2013 | -- | $125,016 | $22,500 | $102,516 |
Source: Public Records
Map
Nearby Homes
- 806 Cliftwood Dr
- 803 Woodland Dr
- 1007 Driftwood Dr
- 1004 Candlewood Cir
- 1501 Duet Dr
- 1707 N Chatham Ave
- Tbd W 3rd St
- 0 W 3rd St
- 1306 Sunset Dr
- 519 W Raleigh St
- 409 E 10th St
- 303 W Dolphin St
- 2200 W 3rd St
- 513 W Glendale St
- 128 Olde Manor Ct
- 2248 W 3rd St
- 0 Airport Rd Unit 10131777
- TBD E 3rd St
- 701 S Chatham Ave
- 00 U S Highway 64
- 810 Cliftwood Dr
- 809 Driftwood Dr
- 811 Driftwood Dr
- 807 Driftwood Dr
- 812 Cliftwood Dr
- 813 Driftwood Dr
- 807 Cliftwood Dr
- 805 Driftwood Dr
- 814 Cliftwood Dr
- 802 Cliftwood Dr
- 918 N Glenn Ave
- 905 N Garden Ave
- 920 N Glenn Ave
- 810 Driftwood Dr
- 808 Driftwood Dr
- 812 Driftwood Dr
- 907 N Garden Ave
- 816 Cliftwood Dr
- 801 Cliftwood Dr
- 814 Driftwood Dr