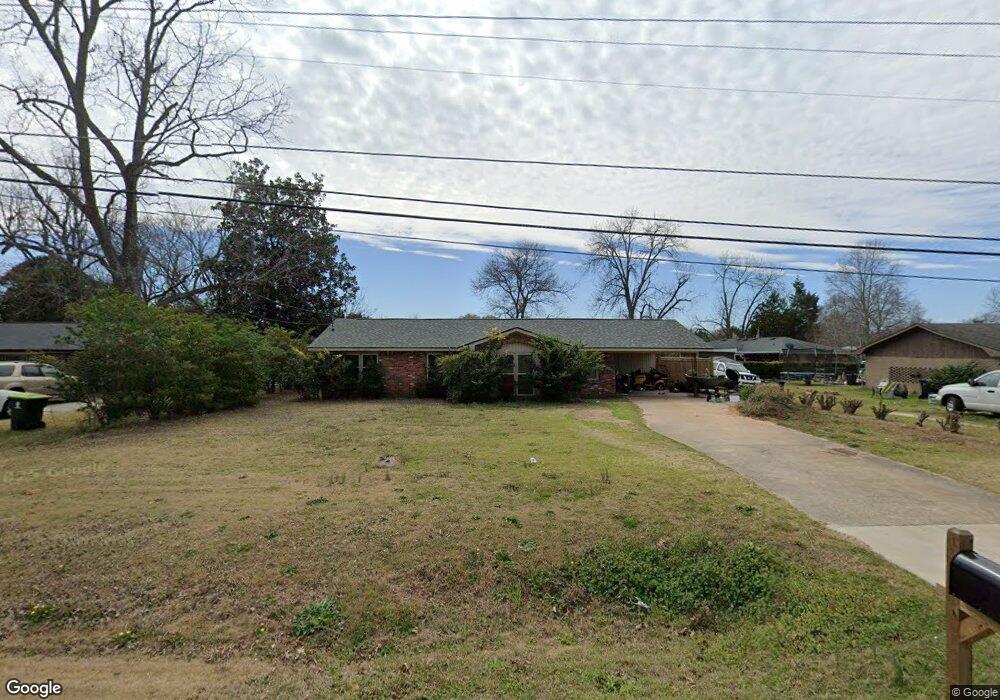
808 Dunbar Rd Warner Robins, GA 31093
Estimated Value: $146,000 - $218,000
3
Beds
2
Baths
1,414
Sq Ft
$128/Sq Ft
Est. Value
About This Home
This home is located at 808 Dunbar Rd, Warner Robins, GA 31093 and is currently estimated at $181,153, approximately $128 per square foot. 808 Dunbar Rd is a home located in Houston County with nearby schools including Centerville Elementary School, Northside Middle School, and Northside High School.
Ownership History
Date
Name
Owned For
Owner Type
Purchase Details
Closed on
Jul 22, 2015
Sold by
Stephens Charley Roscoe Es
Bought by
Moss Brandon and Moss Cara
Current Estimated Value
Home Financials for this Owner
Home Financials are based on the most recent Mortgage that was taken out on this home.
Original Mortgage
$58,913
Outstanding Balance
$45,585
Interest Rate
4.04%
Mortgage Type
FHA
Estimated Equity
$135,568
Purchase Details
Closed on
Oct 12, 1976
Sold by
Horne Russell M
Bought by
Stephens Charley R and Stephens Patsy A
Purchase Details
Closed on
Aug 25, 1976
Sold by
Muncy James W and Muncy Bonnie L
Bought by
Horne Russell M
Purchase Details
Closed on
Jul 2, 1975
Sold by
Rollins Thomas Edgar and Rollins Kar
Bought by
Muncy James W and Muncy Bonnie L
Purchase Details
Closed on
Jul 10, 1974
Sold by
Paramount Realty Co
Bought by
Rollins Thomas Edgar and Rollins Karen B
Purchase Details
Closed on
Nov 15, 1973
Sold by
Builders Home Of Georgia
Bought by
Paramount Realty Co
Create a Home Valuation Report for This Property
The Home Valuation Report is an in-depth analysis detailing your home's value as well as a comparison with similar homes in the area
Home Values in the Area
Average Home Value in this Area
Purchase History
| Date | Buyer | Sale Price | Title Company |
|---|---|---|---|
| Moss Brandon | $60,000 | -- | |
| Stephens Charley R | -- | -- | |
| Horne Russell M | -- | -- | |
| Muncy James W | -- | -- | |
| Rollins Thomas Edgar | -- | -- | |
| Paramount Realty Co | -- | -- |
Source: Public Records
Mortgage History
| Date | Status | Borrower | Loan Amount |
|---|---|---|---|
| Open | Moss Brandon | $58,913 |
Source: Public Records
Tax History
| Year | Tax Paid | Tax Assessment Tax Assessment Total Assessment is a certain percentage of the fair market value that is determined by local assessors to be the total taxable value of land and additions on the property. | Land | Improvement |
|---|---|---|---|---|
| 2025 | $1,740 | $59,760 | $8,000 | $51,760 |
| 2024 | $1,764 | $53,920 | $8,000 | $45,920 |
| 2023 | $1,468 | $44,520 | $8,000 | $36,520 |
| 2022 | $825 | $35,880 | $7,200 | $28,680 |
| 2021 | $697 | $30,160 | $5,400 | $24,760 |
| 2020 | $678 | $29,200 | $5,400 | $23,800 |
| 2019 | $678 | $29,200 | $5,400 | $23,800 |
| 2018 | $678 | $29,200 | $5,400 | $23,800 |
| 2017 | $679 | $29,200 | $5,400 | $23,800 |
| 2016 | $559 | $29,800 | $5,400 | $24,400 |
| 2015 | -- | $29,800 | $5,400 | $24,400 |
| 2014 | -- | $29,800 | $5,400 | $24,400 |
| 2013 | -- | $29,880 | $4,840 | $25,040 |
Source: Public Records
Map
Nearby Homes
- 110 Stonefield Ct
- 205 Scarborough Rd
- 136 Scarborough Rd
- 203 River Birch Way
- 106 Scarborough Rd
- 319 Air View Dr Unit 14
- 106 Maple Glen Ct
- 312 Hickory Glen
- 105 Maple Glen Ct
- 218 Valencia Cir
- 94 Tiffany Ln
- 102 Pine Glen Ct
- 501 Dunbar Rd
- 202 Magnolia Glen
- 210 Webb St
- 60 Tiffany Ln
- 414 Forest Lake Dr
- 156 Martin Mill Trail
- 105 Mitchell Ct
- 201 Custer Dr
- 806 Dunbar Rd
- 810 Dunbar Rd
- 502 Scarborough Rd
- 126 Barnesdale Dr
- 804 Dunbar Rd
- 128 Barnesdale Dr
- 124 Barnesdale Dr
- 803 Dunbar Rd
- 802 Dunbar Rd
- 122 Barnesdale Dr
- 505 Scarborough Rd
- 515 Scarborough Rd
- 511 Scarborough Rd
- 120 Barnesdale Dr
- 800 Dunbar Rd
- 509 Scarborough Rd
- 410 Scarborough Rd
- 121 Barnesdale Dr
- 507 Scarborough Rd
- 118 Barnesdale Dr
Your Personal Tour Guide
Ask me questions while you tour the home.