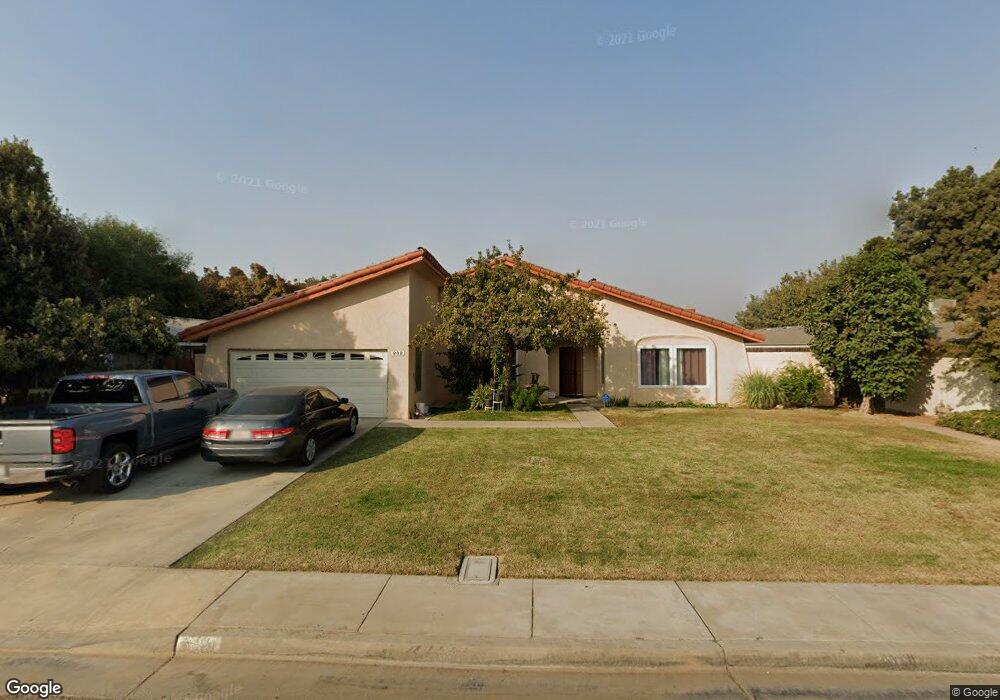
808 E Ann Dr Reedley, CA 93654
Estimated Value: $392,000 - $402,420
About This Home
This home is located at 808 E Ann Dr, Reedley, CA 93654 and is currently estimated at $398,105, approximately $217 per square foot. 808 E Ann Dr is a home located in Fresno County with nearby schools including Thomas Law Reed Elementary School, Reedley High School, and Reedley Middle College High.
Ownership History
We collect this data history from publicly available records. To have your information removed, we recommend requesting removal directly through your county’s website.
Purchase Details
Home Financials for this Owner
Home Financials are based on the most recent Mortgage that was taken out on this home.Purchase Details
Purchase Details
Purchase Details
Home Financials for this Owner
Home Financials are based on the most recent Mortgage that was taken out on this home.Home Values in the Area
Average Home Value in this Area
Purchase History
We collect this data history from publicly available records. To have your information removed, we recommend requesting removal directly through your county’s website.
| Date | Buyer | Sale Price | Title Company |
|---|---|---|---|
| $100,000 | North American Title Co | ||
| -- | First American Title Ins Co | ||
| -- | First American Title Ins Co | ||
| $124,679 | First American Title Ins Co | ||
| $115,500 | Chicago Title Co |
Mortgage History
We collect this data history from publicly available records. To have your information removed, we recommend requesting removal directly through your county’s website.
| Date | Status | Borrower | Loan Amount |
|---|---|---|---|
| Open | $99,673 | ||
| Previous Owner | $109,356 |
Tax History
We collect this data history from publicly available records. To have your information removed, we recommend requesting removal directly through your county’s website.
| Year | Tax Paid | Tax Assessment Tax Assessment Total Assessment is a certain percentage of the fair market value that is determined by local assessors to be the total taxable value of land and additions on the property. | Land | Improvement |
|---|---|---|---|---|
| 2025 | $1,668 | $150,656 | $45,191 | $105,465 |
| 2023 | $1,630 | $144,808 | $43,437 | $101,371 |
| 2022 | $1,634 | $141,970 | $42,586 | $99,384 |
| 2021 | $1,594 | $139,187 | $41,751 | $97,436 |
| 2020 | $1,611 | $137,760 | $41,323 | $96,437 |
| 2019 | $1,562 | $135,060 | $40,513 | $94,547 |
| 2018 | $1,560 | $132,413 | $39,719 | $92,694 |
| 2017 | $1,483 | $129,818 | $38,941 | $90,877 |
| 2016 | $1,509 | $127,274 | $38,178 | $89,096 |
| 2015 | $1,454 | $125,363 | $37,605 | $87,758 |
| 2014 | $1,453 | $122,908 | $36,869 | $86,039 |
Map
- 19317 E Parlier Ave
- 20532 E Parlier Ave
- 1153 N Pecan Ave
- 1405 E Cypress Ave Unit 157
- 1405 E Cypress Ave
- 1405 E Cypress Ave Unit 137
- 748 N East Ave
- 645 E Sierra Ave
- 333 E Linden Ave
- 214 E Linden Ave
- 454 E Sierra Ave
- 602 E Abbott Ave
- 1852 N Hollywood Dr
- 570 N Birch Ave
- 19342 E South Ave
- 657 W Parlier Ave Unit 114
- 657 W Parlier Ave Unit 125
- 19282 E South Ave
- 1231 C St
- 1284 N Riverview Ave
- 838 E Ann Dr
- 788 E Ann Dr
- 858 E Ann Dr
- 1438 N Steven Ave
- 785 E Ann Dr
- 8581 S Columbia Ave
- 736 E Ann Dr
- 765 E Ann Dr
- 1477 N Columbia Ave
- 1418 N Steven Ave
- 875 E Ann Dr
- 790 E Kip Patrick Dr
- 745 E Ann Dr
- 1417 N Columbia Ave
- 1398 N Steven Ave
- 766 E Kip Patrick Dr
- 8565 S Columbia Ave
- 746 E Kip Patrick Dr
- 1397 N Columbia Ave
- 721 E Ann Dr
Ask me questions while you tour the home.