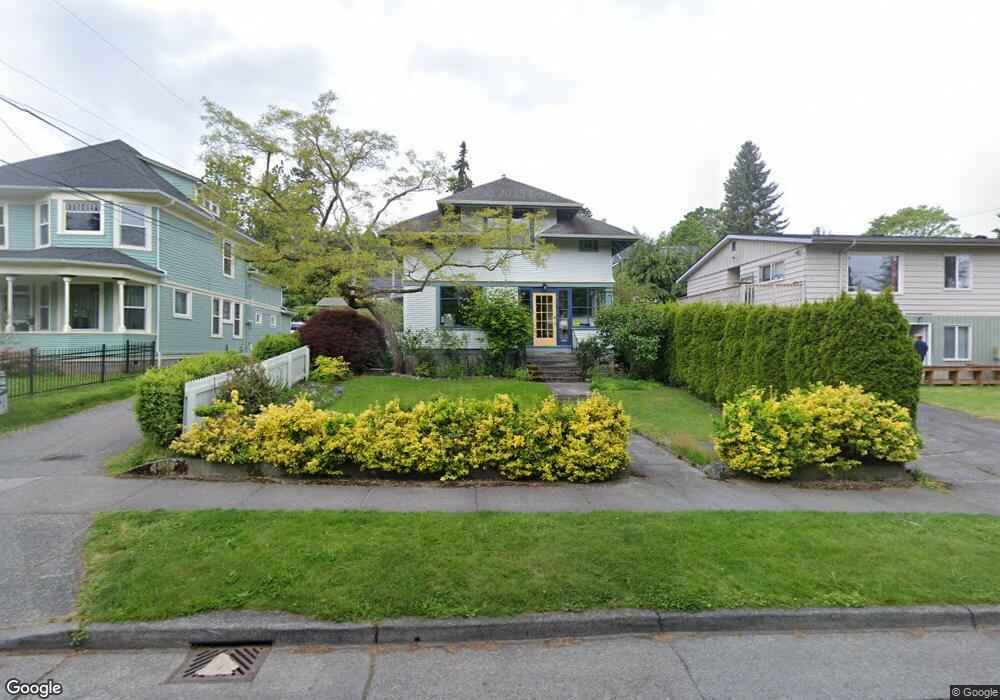
808 E Maple St Bellingham, WA 98225
Sehome NeighborhoodEstimated Value: $725,000 - $888,000
3
Beds
1
Bath
1,786
Sq Ft
$451/Sq Ft
Est. Value
About This Home
This home is located at 808 E Maple St, Bellingham, WA 98225 and is currently estimated at $805,359, approximately $450 per square foot. 808 E Maple St is a home located in Whatcom County with nearby schools including Happy Valley Elementary School, Fairhaven Middle School, and Sehome High School.
Ownership History
Date
Name
Owned For
Owner Type
Purchase Details
Closed on
Sep 2, 2005
Sold by
Potts Randall C and Rootenberg Robin
Bought by
Monroe Charles R and Monroe Roberta S
Current Estimated Value
Home Financials for this Owner
Home Financials are based on the most recent Mortgage that was taken out on this home.
Original Mortgage
$230,000
Outstanding Balance
$119,610
Interest Rate
5.7%
Mortgage Type
New Conventional
Estimated Equity
$685,749
Purchase Details
Closed on
Sep 9, 2003
Sold by
Weissenborn William A and Steele Julie Anne
Bought by
Rootenberg Robin and Potts Randall C
Home Financials for this Owner
Home Financials are based on the most recent Mortgage that was taken out on this home.
Original Mortgage
$256,700
Interest Rate
6.06%
Mortgage Type
Purchase Money Mortgage
Create a Home Valuation Report for This Property
The Home Valuation Report is an in-depth analysis detailing your home's value as well as a comparison with similar homes in the area
Home Values in the Area
Average Home Value in this Area
Purchase History
| Date | Buyer | Sale Price | Title Company |
|---|---|---|---|
| Monroe Charles R | $380,280 | Chicago Title Insurance | |
| Rootenberg Robin | $302,000 | Stewart Title Company |
Source: Public Records
Mortgage History
| Date | Status | Borrower | Loan Amount |
|---|---|---|---|
| Open | Monroe Charles R | $230,000 | |
| Previous Owner | Rootenberg Robin | $256,700 |
Source: Public Records
Tax History
| Year | Tax Paid | Tax Assessment Tax Assessment Total Assessment is a certain percentage of the fair market value that is determined by local assessors to be the total taxable value of land and additions on the property. | Land | Improvement |
|---|---|---|---|---|
| 2025 | $6,176 | $777,101 | $278,528 | $498,573 |
| 2024 | $6,020 | $754,477 | $270,419 | $484,058 |
| 2023 | $6,020 | $773,686 | $277,304 | $496,382 |
| 2022 | $4,758 | $655,679 | $235,008 | $420,671 |
| 2021 | $4,668 | $512,249 | $183,600 | $328,649 |
| 2020 | $4,810 | $474,305 | $170,000 | $304,305 |
| 2019 | $4,531 | $472,404 | $147,260 | $325,144 |
| 2018 | $4,567 | $446,131 | $139,161 | $306,970 |
| 2017 | $3,977 | $384,451 | $119,599 | $264,852 |
| 2016 | $3,544 | $349,920 | $108,754 | $241,166 |
| 2015 | $3,552 | $324,587 | $102,585 | $222,002 |
| 2014 | -- | $314,827 | $99,500 | $215,327 |
| 2013 | -- | $306,500 | $97,350 | $209,150 |
Source: Public Records
Map
Nearby Homes
- 1028 Billy Frank Jr St Unit 301
- 924 N Garden St Unit 201
- 1205 E Maple St
- 826 N Garden St
- 819 High St Unit 101
- 819 High St Unit 317
- 1126 N Forest St
- 901 N Forest St Unit 123
- 901 N Forest St Unit 109
- 1031 N State St Unit 107
- 1001 N State St Unit 209
- 820 N State St Unit 520
- 820 N State St Unit 505
- 820 N State St Unit 521
- 820 N State St Unit 513
- 715 N Garden St Unit 502
- 119 N Samish Way Unit 30
- 310 E Ivy St
- 1310 Railroad Ave
- 508 Gladstone St
Your Personal Tour Guide
Ask me questions while you tour the home.