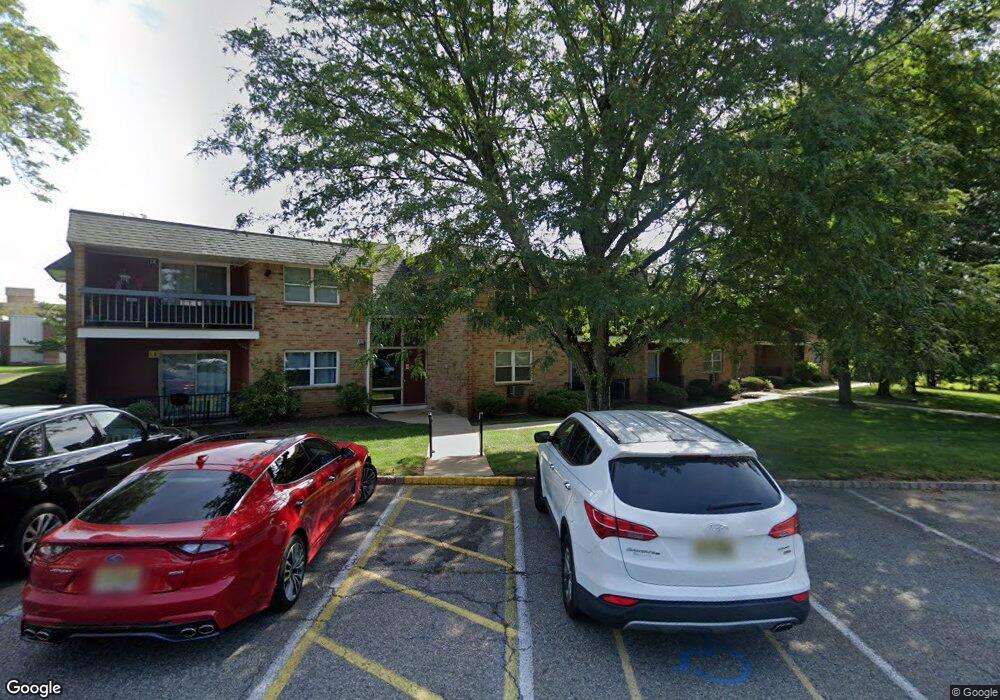
808 Eves Dr Unit 1A Hillsborough, NJ 08844
Estimated Value: $252,000 - $311,491
2
Beds
2
Baths
1,248
Sq Ft
$232/Sq Ft
Est. Value
About This Home
This home is located at 808 Eves Dr Unit 1A, Hillsborough, NJ 08844 and is currently estimated at $289,373, approximately $231 per square foot. 808 Eves Dr Unit 1A is a home located in Somerset County with nearby schools including Hillsborough High School, Brighthorizons at Hillsborough, and Cherry Blossom Montessori School.
Ownership History
Date
Name
Owned For
Owner Type
Purchase Details
Closed on
Jul 27, 2023
Sold by
Chopra Ashok
Bought by
Kanuganti Venugopata and Banda Srujana
Current Estimated Value
Home Financials for this Owner
Home Financials are based on the most recent Mortgage that was taken out on this home.
Original Mortgage
$153,750
Interest Rate
7.12%
Mortgage Type
New Conventional
Purchase Details
Closed on
Sep 12, 2021
Sold by
Desai Lavanya
Bought by
Chopra Ashok
Home Financials for this Owner
Home Financials are based on the most recent Mortgage that was taken out on this home.
Original Mortgage
$189,000
Interest Rate
2.7%
Mortgage Type
New Conventional
Purchase Details
Closed on
Jan 24, 2004
Sold by
Wowchuck Nicholas J
Bought by
Desai Lavanya H
Home Financials for this Owner
Home Financials are based on the most recent Mortgage that was taken out on this home.
Original Mortgage
$80,000
Interest Rate
5.1%
Mortgage Type
New Conventional
Create a Home Valuation Report for This Property
The Home Valuation Report is an in-depth analysis detailing your home's value as well as a comparison with similar homes in the area
Home Values in the Area
Average Home Value in this Area
Purchase History
| Date | Buyer | Sale Price | Title Company |
|---|---|---|---|
| Kanuganti Venugopata | $205,000 | None Listed On Document | |
| Kanuganti Venugopata | $205,000 | None Listed On Document | |
| Chopra Ashok | $210,000 | Lemonbrew Abstract Llc | |
| Desai Lavanya H | $167,000 | -- |
Source: Public Records
Mortgage History
| Date | Status | Borrower | Loan Amount |
|---|---|---|---|
| Previous Owner | Kanuganti Venugopata | $153,750 | |
| Previous Owner | Chopra Ashok | $189,000 | |
| Previous Owner | Desai Lavanya H | $80,000 |
Source: Public Records
Tax History Compared to Growth
Tax History
| Year | Tax Paid | Tax Assessment Tax Assessment Total Assessment is a certain percentage of the fair market value that is determined by local assessors to be the total taxable value of land and additions on the property. | Land | Improvement |
|---|---|---|---|---|
| 2025 | $4,477 | $244,900 | $125,000 | $119,900 |
| 2024 | $4,477 | $208,900 | $105,000 | $103,900 |
| 2023 | $4,340 | $201,600 | $90,000 | $111,600 |
| 2022 | $4,071 | $182,300 | $70,000 | $112,300 |
| 2021 | $3,884 | $167,300 | $55,000 | $112,300 |
| 2020 | $3,884 | $162,900 | $50,000 | $112,900 |
| 2019 | $3,635 | $151,200 | $48,500 | $102,700 |
| 2018 | $3,464 | $143,200 | $48,500 | $94,700 |
| 2017 | $3,268 | $135,300 | $40,000 | $95,300 |
| 2016 | $3,281 | $135,900 | $40,000 | $95,900 |
| 2015 | $3,514 | $147,400 | $45,000 | $102,400 |
| 2014 | $3,447 | $147,700 | $40,000 | $107,700 |
Source: Public Records
Map
Nearby Homes
- 595 Auten Rd Unit 5
- 806 Eves Dr Unit 1B
- 597 Auten Rd Unit 2
- 807 Eves Dr Unit 1B
- 790 Eves Dr
- 3610 Royce Ct
- 911 Renate Dr Unit 1
- 3320 Richmond Ct
- 3120 Revere Ct
- 3204 Revere Ct
- 3512 Bloomingdale Dr
- 61 Wallace Blvd
- 3007 Revere Ct
- 3011 Revere Ct
- 3712 Bloomingdale Dr
- 35 Bloomingdale Dr
- 107 Bluebird Dr Unit 1D
- 3211 Bloomingdale Dr Unit 1
- 118 Bluebird Dr Unit 3
- 91 Crickhollow Ct
- 808 Eves Dr Unit 2H
- 808 Eves Dr Unit 1K
- 808 Eves Dr Unit 3P
- 808 Eves Dr Unit 2S
- 808 Eves Dr Unit 1T
- 808 Eves Dr Unit 2M
- 808 Eves Dr Unit 3F
- 808 Eves Dr Unit 2D
- 808 Eves Dr Unit 3Q
- 808 Eves Dr Unit 3O
- 808 Eves Dr Unit 2N
- 808 Eves Dr Unit 1L
- 808 Eves Dr Unit 1J
- 808 Eves Dr Unit 2I
- 808 Eves Dr Unit 3G
- 808 Eves Dr Unit 3E
- 808 Eves Dr Unit 2C
- 808 Eves Dr Unit 1B
- 808 Eves Dr
- 585 Auten Rd Unit 2