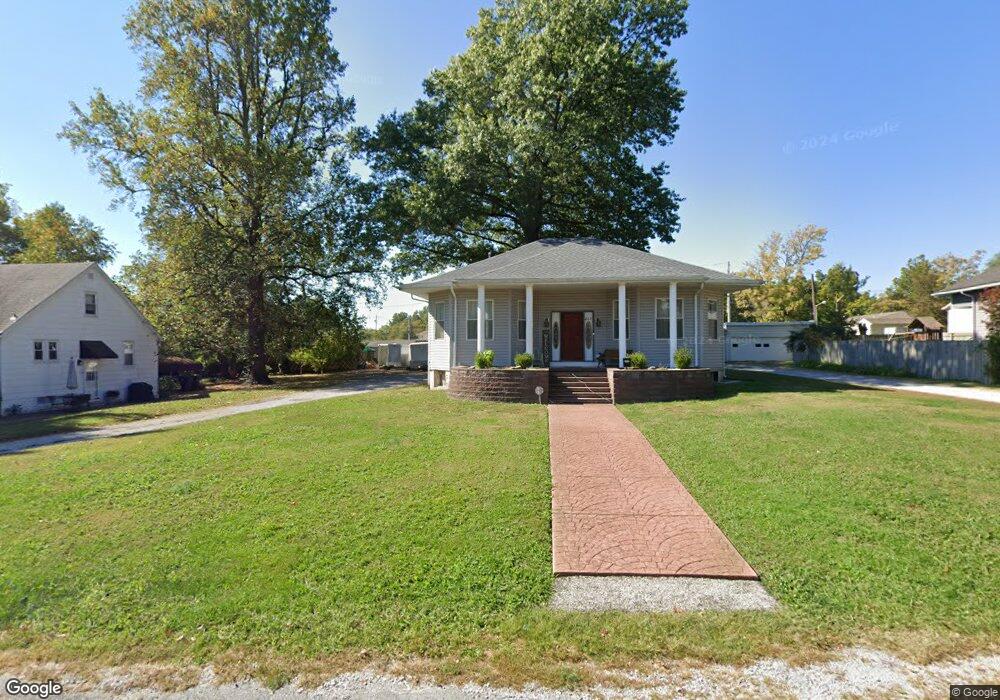
808 Gass Ave Belleville, IL 62220
Estimated Value: $145,000 - $164,000
Studio
--
Bath
1,131
Sq Ft
$139/Sq Ft
Est. Value
About This Home
This home is located at 808 Gass Ave, Belleville, IL 62220 and is currently estimated at $157,090, approximately $138 per square foot. 808 Gass Ave is a home located in St. Clair County with nearby schools including Henry Raab Elementary School, Central Jr High School, and Governor French Academy.
Ownership History
Date
Name
Owned For
Owner Type
Purchase Details
Closed on
Sep 4, 2012
Sold by
Schobert Mike and Schobert Laurie
Bought by
Schobert Mike and Schobert Laurie
Current Estimated Value
Home Financials for this Owner
Home Financials are based on the most recent Mortgage that was taken out on this home.
Original Mortgage
$80,500
Outstanding Balance
$12,934
Interest Rate
3%
Mortgage Type
New Conventional
Estimated Equity
$144,156
Purchase Details
Closed on
Jul 13, 1998
Bought by
Schobert Mike and Schobert Laurie
Create a Home Valuation Report for This Property
The Home Valuation Report is an in-depth analysis detailing your home's value as well as a comparison with similar homes in the area
Home Values in the Area
Average Home Value in this Area
Purchase History
| Date | Buyer | Sale Price | Title Company |
|---|---|---|---|
| Schobert Mike | -- | Fatic | |
| Schobert Mike | $60,000 | -- |
Source: Public Records
Mortgage History
| Date | Status | Borrower | Loan Amount |
|---|---|---|---|
| Open | Schobert Mike | $80,500 |
Source: Public Records
Tax History
| Year | Tax Paid | Tax Assessment Tax Assessment Total Assessment is a certain percentage of the fair market value that is determined by local assessors to be the total taxable value of land and additions on the property. | Land | Improvement |
|---|---|---|---|---|
| 2024 | $3,544 | $46,296 | $6,765 | $39,531 |
| 2023 | $3,611 | $44,468 | $6,631 | $37,837 |
| 2022 | $3,257 | $40,033 | $5,970 | $34,063 |
| 2021 | $3,092 | $37,009 | $5,519 | $31,490 |
| 2020 | $2,979 | $34,998 | $5,219 | $29,779 |
| 2019 | $2,663 | $31,701 | $5,227 | $26,474 |
| 2018 | $2,590 | $31,016 | $5,114 | $25,902 |
| 2017 | $2,571 | $30,798 | $5,078 | $25,720 |
| 2016 | $2,533 | $30,550 | $4,970 | $25,580 |
| 2014 | $2,530 | $33,365 | $8,497 | $24,868 |
| 2013 | $2,554 | $33,843 | $8,619 | $25,224 |
Source: Public Records
Map
Nearby Homes
- 807 Gass Ave
- 817 Union Ave
- 419 S 8th St
- 417 S 8th St
- 413 S 8th St
- 719 Centreville Ave
- 1316 Raab Ave
- 1210 3rd Ave
- 611 Centreville Ave
- 420 State St
- 508 Centreville Ave
- 1412 4th Ave
- 508 Bornman St
- 22 S 15th St
- 1366 Radden Ct
- 1223 W Main St
- 23 N 11th St
- 00 W Washington St
- 20 S 17th St
- 1374 Rocky Creek Ct
Your Personal Tour Guide
Ask me questions while you tour the home.