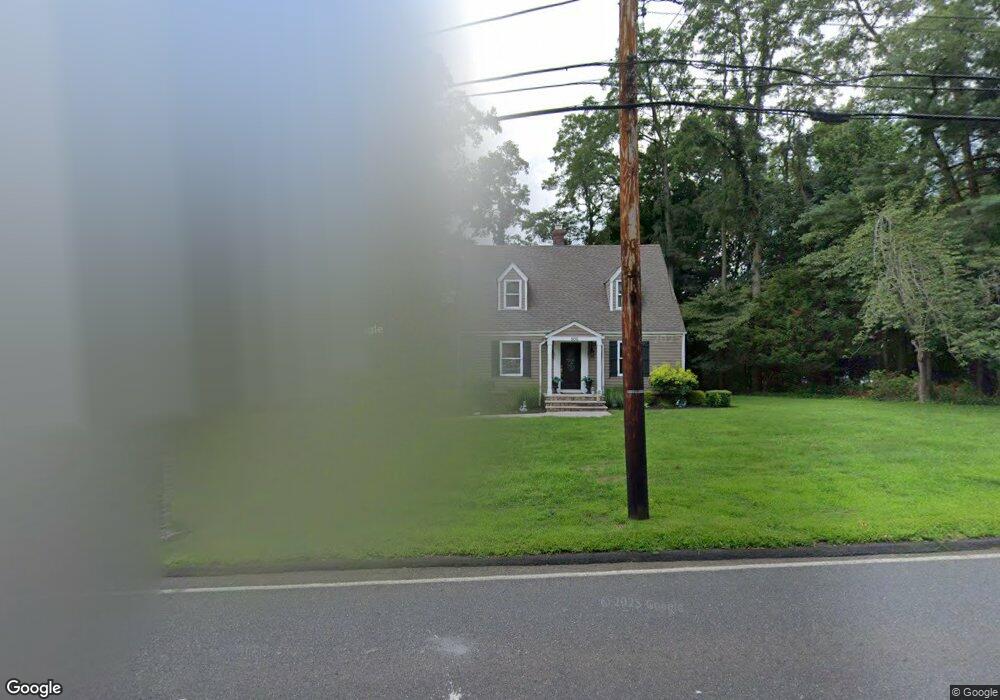
808 Holmdel Rd Holmdel, NJ 07733
Estimated Value: $855,922 - $977,000
4
Beds
2
Baths
1,859
Sq Ft
$496/Sq Ft
Est. Value
About This Home
This home is located at 808 Holmdel Rd, Holmdel, NJ 07733 and is currently estimated at $921,231, approximately $495 per square foot. 808 Holmdel Rd is a home located in Monmouth County with nearby schools including Village School, Indian Hill Elementary School, and William Satz Intermediate School.
Ownership History
Date
Name
Owned For
Owner Type
Purchase Details
Closed on
Dec 29, 2009
Sold by
Yesko Shawn
Bought by
Buckley Craig M and Buckley Silvana
Current Estimated Value
Home Financials for this Owner
Home Financials are based on the most recent Mortgage that was taken out on this home.
Original Mortgage
$300,000
Outstanding Balance
$195,261
Interest Rate
4.78%
Mortgage Type
New Conventional
Estimated Equity
$725,970
Purchase Details
Closed on
Mar 4, 2009
Sold by
Bank Of America National Association
Bought by
Yesko Shawn
Purchase Details
Closed on
Aug 28, 2003
Sold by
Young Robert
Bought by
Libis Margaret
Home Financials for this Owner
Home Financials are based on the most recent Mortgage that was taken out on this home.
Original Mortgage
$274,000
Interest Rate
6.35%
Create a Home Valuation Report for This Property
The Home Valuation Report is an in-depth analysis detailing your home's value as well as a comparison with similar homes in the area
Home Values in the Area
Average Home Value in this Area
Purchase History
| Date | Buyer | Sale Price | Title Company |
|---|---|---|---|
| Buckley Craig M | $449,900 | None Available | |
| Yesko Shawn | $250,000 | Interstate 1St Title Agency | |
| Libis Margaret | $354,000 | -- |
Source: Public Records
Mortgage History
| Date | Status | Borrower | Loan Amount |
|---|---|---|---|
| Open | Buckley Craig M | $300,000 | |
| Previous Owner | Libis Margaret | $274,000 |
Source: Public Records
Tax History
| Year | Tax Paid | Tax Assessment Tax Assessment Total Assessment is a certain percentage of the fair market value that is determined by local assessors to be the total taxable value of land and additions on the property. | Land | Improvement |
|---|---|---|---|---|
| 2025 | $10,298 | $726,100 | $406,700 | $319,400 |
| 2024 | $9,998 | $653,400 | $363,000 | $290,400 |
Source: Public Records
Map
Nearby Homes
- 798 Holmdel Rd
- 1 Davey Place
- 16 S Beers St
- 15 Goldsmith Dr
- 11 Goldsmith Dr
- 3 Tolas Dr
- 8 Aspen Ct
- 7 Flora Dr
- 99 Idlebrook Ln
- 72 Idlebrook Ln
- 17 Idlebrook Ln
- 11 Chestnut Ridge Rd
- 47 White Oak Ln
- 16 Briarhill Rd
- 611 Wellington Place
- 118 State Route 34
- 101 Cresci Blvd
- 315 Wellington Place
- 184 Edinburgh Ct Unit 184
- 141 Eastwick Ct Unit 141
Your Personal Tour Guide
Ask me questions while you tour the home.