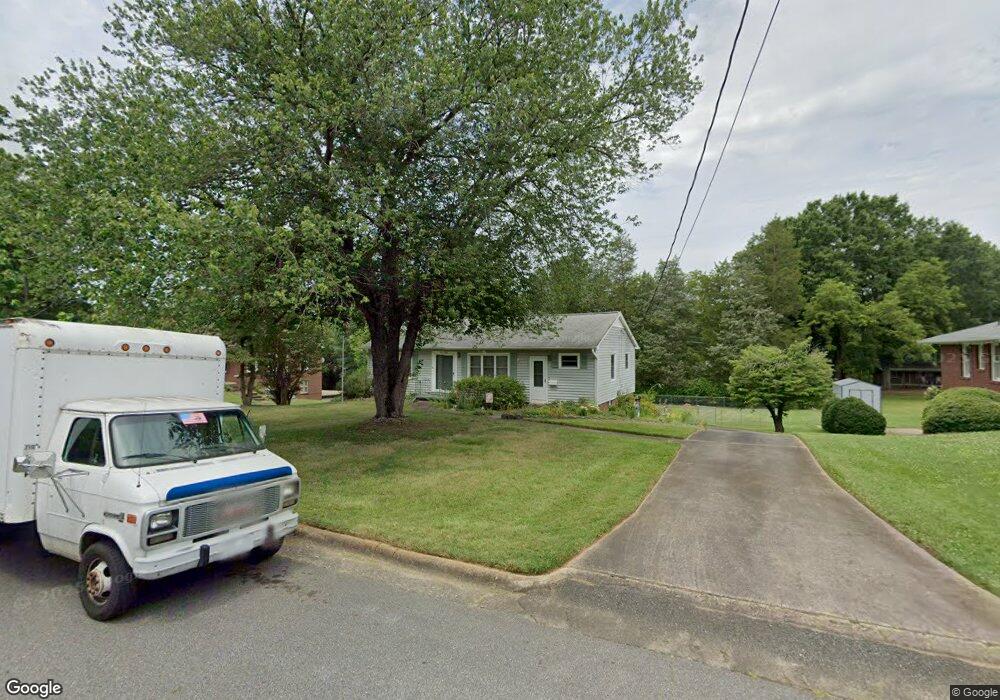
808 Howard St Shelby, NC 28152
Estimated Value: $173,382 - $201,000
Studio
--
Bath
1,188
Sq Ft
$156/Sq Ft
Est. Value
About This Home
This home is located at 808 Howard St, Shelby, NC 28152 and is currently estimated at $185,846, approximately $156 per square foot. 808 Howard St is a home located in Cleveland County with nearby schools including James Love Elementary School, Shelby Middle School, and Shelby High School.
Ownership History
Date
Name
Owned For
Owner Type
Purchase Details
Closed on
May 20, 2010
Sold by
Wray Cheryl H
Bought by
Velthuysen Holly Ann
Current Estimated Value
Home Financials for this Owner
Home Financials are based on the most recent Mortgage that was taken out on this home.
Original Mortgage
$78,837
Outstanding Balance
$51,945
Interest Rate
5.02%
Mortgage Type
FHA
Estimated Equity
$133,901
Purchase Details
Closed on
Jan 2, 2006
Sold by
Hubbard Ruby D
Bought by
Wray Cheryl H and Hubbard Family Irrevocable Trust
Create a Home Valuation Report for This Property
The Home Valuation Report is an in-depth analysis detailing your home's value as well as a comparison with similar homes in the area
Home Values in the Area
Average Home Value in this Area
Purchase History
| Date | Buyer | Sale Price | Title Company |
|---|---|---|---|
| Velthuysen Holly Ann | $80,000 | None Available | |
| Wray Cheryl H | -- | None Available |
Source: Public Records
Mortgage History
| Date | Status | Borrower | Loan Amount |
|---|---|---|---|
| Open | Velthuysen Holly Ann | $78,837 |
Source: Public Records
Tax History
| Year | Tax Paid | Tax Assessment Tax Assessment Total Assessment is a certain percentage of the fair market value that is determined by local assessors to be the total taxable value of land and additions on the property. | Land | Improvement |
|---|---|---|---|---|
| 2025 | $1,449 | $145,642 | $17,424 | $128,218 |
| 2024 | $681 | $54,459 | $13,068 | $41,391 |
| 2023 | $681 | $54,459 | $13,068 | $41,391 |
| 2022 | $678 | $54,459 | $13,068 | $41,391 |
| 2021 | $681 | $54,459 | $13,068 | $41,391 |
| 2020 | $543 | $41,921 | $10,890 | $31,031 |
| 2019 | $543 | $41,921 | $10,890 | $31,031 |
| 2018 | $542 | $41,921 | $10,890 | $31,031 |
| 2017 | $528 | $41,921 | $10,890 | $31,031 |
| 2016 | $529 | $41,921 | $10,890 | $31,031 |
| 2015 | $761 | $64,239 | $11,979 | $52,260 |
| 2014 | $761 | $64,239 | $11,979 | $52,260 |
Source: Public Records
Map
Nearby Homes
Your Personal Tour Guide
Ask me questions while you tour the home.