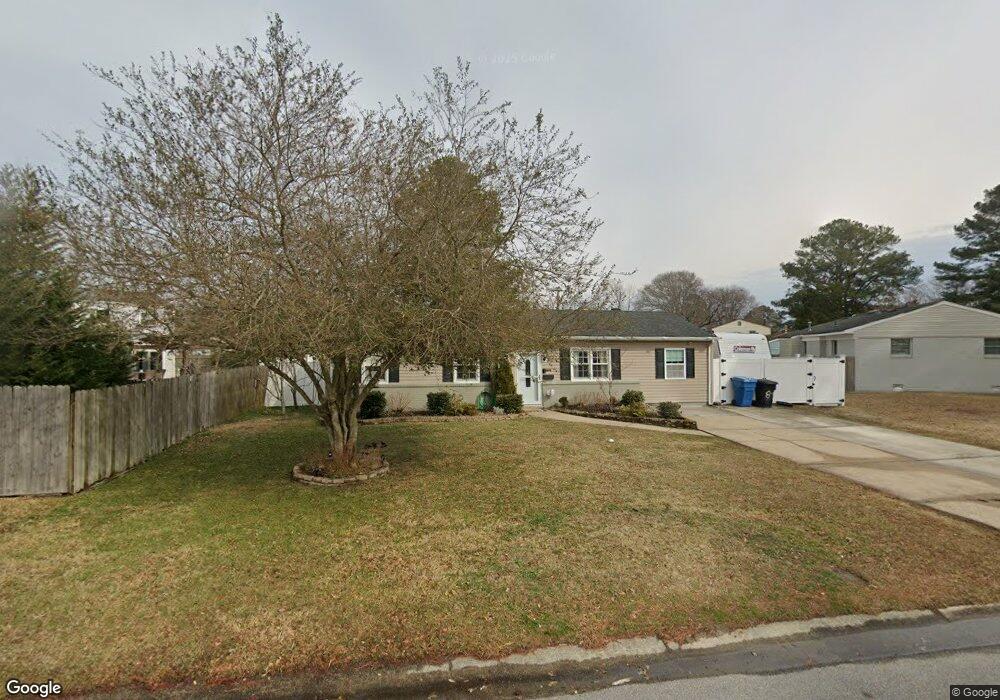
808 Kings Arms Dr Virginia Beach, VA 23452
Bow Creek NeighborhoodEstimated Value: $360,333 - $420,000
4
Beds
2
Baths
1,654
Sq Ft
$235/Sq Ft
Est. Value
About This Home
This home is located at 808 Kings Arms Dr, Virginia Beach, VA 23452 and is currently estimated at $388,583, approximately $234 per square foot. 808 Kings Arms Dr is a home located in Virginia Beach City with nearby schools including Brookwood Elementary School, Corporate Landing Middle School, and Ocean Lakes High School.
Ownership History
Date
Name
Owned For
Owner Type
Purchase Details
Closed on
Jul 30, 2021
Sold by
Nation Melanie M and Lancaster Eric M
Bought by
Lancaster Eric M and Lancaster Melanie M
Current Estimated Value
Home Financials for this Owner
Home Financials are based on the most recent Mortgage that was taken out on this home.
Original Mortgage
$195,500
Outstanding Balance
$149,687
Interest Rate
3%
Mortgage Type
New Conventional
Estimated Equity
$238,896
Purchase Details
Closed on
Jun 24, 2015
Sold by
Brown Thomas A
Bought by
Lancaster Eric M and Nataion Melanie M
Home Financials for this Owner
Home Financials are based on the most recent Mortgage that was taken out on this home.
Original Mortgage
$223,100
Interest Rate
3.84%
Mortgage Type
New Conventional
Purchase Details
Closed on
Sep 18, 2014
Sold by
Pearce Arthur D
Bought by
Brown Thomas A
Create a Home Valuation Report for This Property
The Home Valuation Report is an in-depth analysis detailing your home's value as well as a comparison with similar homes in the area
Home Values in the Area
Average Home Value in this Area
Purchase History
| Date | Buyer | Sale Price | Title Company |
|---|---|---|---|
| Lancaster Eric M | -- | New Title Company Name | |
| Lancaster Eric M | -- | Westcor Land Title Ins Co | |
| Lancaster Eric M | $230,000 | -- | |
| Brown Thomas A | $90,000 | -- |
Source: Public Records
Mortgage History
| Date | Status | Borrower | Loan Amount |
|---|---|---|---|
| Open | Lancaster Eric M | $195,500 | |
| Closed | Lancaster Eric M | $195,500 | |
| Previous Owner | Lancaster Eric M | $223,100 |
Source: Public Records
Tax History Compared to Growth
Tax History
| Year | Tax Paid | Tax Assessment Tax Assessment Total Assessment is a certain percentage of the fair market value that is determined by local assessors to be the total taxable value of land and additions on the property. | Land | Improvement |
|---|---|---|---|---|
| 2025 | $2,929 | $314,100 | $129,000 | $185,100 |
| 2024 | $2,929 | $302,000 | $115,000 | $187,000 |
| 2023 | $2,885 | $291,400 | $111,000 | $180,400 |
| 2022 | $2,678 | $270,500 | $111,000 | $159,500 |
| 2021 | $2,276 | $229,900 | $88,000 | $141,900 |
| 2020 | $2,282 | $224,300 | $80,000 | $144,300 |
| 2019 | $2,252 | $213,300 | $80,000 | $133,300 |
| 2018 | $2,138 | $213,300 | $80,000 | $133,300 |
| 2017 | $2,063 | $205,800 | $72,500 | $133,300 |
| 2016 | $2,037 | $205,800 | $72,500 | $133,300 |
| 2015 | $1,992 | $201,200 | $78,800 | $122,400 |
| 2014 | $1,381 | $140,200 | $84,000 | $56,200 |
Source: Public Records
Map
Nearby Homes
- 3073 Pewter Rd
- 3117 Coach House Ln
- 725 Burgesses Ln
- 816 Holly Hedge Ave
- 733 Lamplight Ln
- 3217 Deer Park Dr
- 3016 Cobblestone Dr
- 701 S Lynnhaven Rd
- 1012 Blue Spring Ln
- 3256 Deer Park Dr
- 3152 Ashaway Rd
- 996 Lynnhaven Pkwy
- 2955 Talon Ct
- 3063 Breslaw Ct
- 720 Fox Run Rd
- 947 Fern Ridge Rd
- 3401 Woodsman Ln
- 1010 Scarborough Ct
- 1110 Ardito Ct
- 3242 Scarborough Way
- 3076 Pewter Rd
- 3081 Bow Creek Blvd
- 3077 Bow Creek Blvd
- 3072 Pewter Rd
- 3073 Bow Creek Blvd
- 813 Kings Arms Dr
- 817 Kings Arms Dr
- 809 Kings Arms Dr
- 3085 Bow Creek Blvd
- 3068 Pewter Rd
- 821 Kings Arms Dr
- 3077 Pewter Rd
- 3069 Bow Creek Blvd
- 805 Kings Arms Dr
- 3080 Bow Creek Blvd
- 3076 Bow Creek Blvd
- 816 Stratford Hall Dr
- 812 Stratford Hall Dr
- 825 Kings Arms Dr
- 3084 Bow Creek Blvd