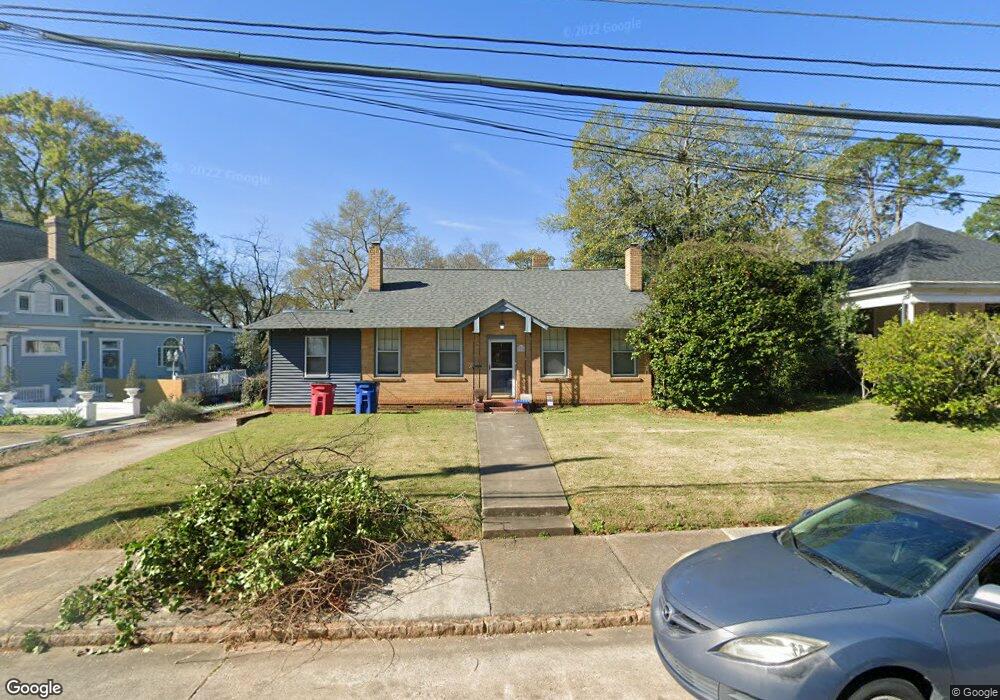
808 Laurel Ave Macon, GA 31211
North Highlands Historic District NeighborhoodEstimated Value: $156,000 - $176,437
4
Beds
2
Baths
1,914
Sq Ft
$88/Sq Ft
Est. Value
About This Home
This home is located at 808 Laurel Ave, Macon, GA 31211 and is currently estimated at $168,359, approximately $87 per square foot. 808 Laurel Ave is a home located in Bibb County with nearby schools including Burdell Elementary School, Appling Middle School, and Northeast High School.
Ownership History
Date
Name
Owned For
Owner Type
Purchase Details
Closed on
Apr 30, 2008
Sold by
Ethridge Joseph A
Bought by
Marney Christopher R and Marney Hanah R
Current Estimated Value
Home Financials for this Owner
Home Financials are based on the most recent Mortgage that was taken out on this home.
Original Mortgage
$101,000
Outstanding Balance
$63,258
Interest Rate
5.84%
Mortgage Type
Unknown
Estimated Equity
$105,101
Purchase Details
Closed on
Jul 31, 2003
Bought by
Ethridge Joseph A
Purchase Details
Closed on
Dec 10, 1999
Purchase Details
Closed on
Aug 6, 1999
Create a Home Valuation Report for This Property
The Home Valuation Report is an in-depth analysis detailing your home's value as well as a comparison with similar homes in the area
Home Values in the Area
Average Home Value in this Area
Purchase History
| Date | Buyer | Sale Price | Title Company |
|---|---|---|---|
| Marney Christopher R | $101,000 | None Available | |
| Ethridge Joseph A | $90,000 | -- | |
| -- | $87,500 | -- | |
| -- | $47,500 | -- |
Source: Public Records
Mortgage History
| Date | Status | Borrower | Loan Amount |
|---|---|---|---|
| Open | Marney Christopher R | $101,000 |
Source: Public Records
Tax History
| Year | Tax Paid | Tax Assessment Tax Assessment Total Assessment is a certain percentage of the fair market value that is determined by local assessors to be the total taxable value of land and additions on the property. | Land | Improvement |
|---|---|---|---|---|
| 2025 | $947 | $53,123 | $5,600 | $47,523 |
| 2024 | $935 | $51,292 | $5,600 | $45,692 |
| 2023 | $432 | $49,461 | $5,600 | $43,861 |
| 2022 | $1,039 | $43,905 | $5,835 | $38,070 |
| 2021 | $929 | $38,295 | $5,039 | $33,256 |
| 2020 | $768 | $33,637 | $4,509 | $29,128 |
| 2019 | $773 | $33,637 | $4,509 | $29,128 |
| 2018 | $1,363 | $33,637 | $4,509 | $29,128 |
| 2017 | $466 | $26,616 | $5,165 | $21,451 |
| 2016 | $421 | $26,616 | $5,165 | $21,451 |
| 2015 | $528 | $25,111 | $5,811 | $19,300 |
| 2014 | $272 | $27,241 | $5,811 | $21,430 |
Source: Public Records
Map
Nearby Homes
- 965 North Ave
- 980 Curry Place
- 833 Parkview Ct
- 1006 Clay Ave Unit 1008,1020,1022
- 1049 Boulevard
- 1020 Clay Ave
- 378 Cowan St
- 390 Cowan St
- 363 AND 361 Woolfolk St
- 363 Woolfolk St Unit 361 Woolfolk Street
- 940 Curry Dr
- 862 Parkview Dr
- 944 Nottingham Dr
- 856 Center St
- 970 Center St
- 990 Center St
- 808 Center St
- 692 Center St
- 690 Center St
- 1174 Davis St E
Your Personal Tour Guide
Ask me questions while you tour the home.