Estimated Value: $127,000 - $218,000
--
Bed
--
Bath
1,184
Sq Ft
$150/Sq Ft
Est. Value
About This Home
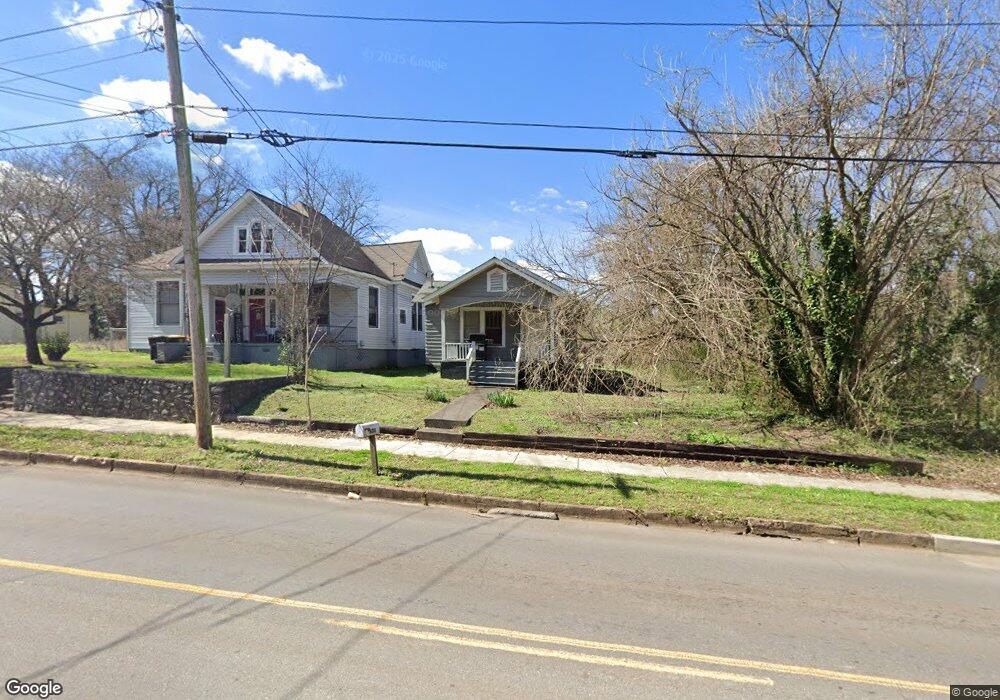
This home is located at 808 Maple Ave SW, Rome, GA 30161 and is currently estimated at $177,770, approximately $150 per square foot. 808 Maple Ave SW is a home located in Floyd County with nearby schools including Dan McCarty Middle School, Rome High School, and St. Mary School.
Ownership History
Date
Name
Owned For
Owner Type
Purchase Details
Closed on
Oct 17, 2013
Sold by
Singh Sarabjeet
Bought by
Singh Harkirat
Current Estimated Value
Purchase Details
Closed on
Jun 27, 2006
Sold by
Not Provided
Bought by
Singh Sarabjeet
Purchase Details
Closed on
Dec 3, 2002
Sold by
Huether Gottlieb
Bought by
Ballenger H M
Purchase Details
Closed on
Feb 1, 1993
Sold by
Youngblood E B
Bought by
Huether Gottlieb Jr Huether Gottlie
Purchase Details
Closed on
Aug 24, 1992
Sold by
Brown Bernard
Bought by
Youngblood E B
Purchase Details
Closed on
Jul 1, 1992
Sold by
First Union National Bank Of Georgia
Bought by
Brown Bernard
Purchase Details
Closed on
Apr 7, 1992
Sold by
Dotson Thomas Richard
Bought by
First Union National Bank Of Georgia
Purchase Details
Closed on
Jul 26, 1989
Sold by
Winkle Jerome A
Bought by
Dotson Thomas Richard
Purchase Details
Closed on
Sep 18, 1987
Sold by
Leonard W L
Bought by
Winkle Jerome A
Purchase Details
Closed on
Jan 1, 1901
Bought by
Leonard W L
Create a Home Valuation Report for This Property
The Home Valuation Report is an in-depth analysis detailing your home's value as well as a comparison with similar homes in the area
Home Values in the Area
Average Home Value in this Area
Purchase History
| Date | Buyer | Sale Price | Title Company |
|---|---|---|---|
| Singh Harkirat | -- | -- | |
| Singh Sarabjeet | -- | -- | |
| Ballenger H M | $6,000 | -- | |
| Huether Gottlieb Jr Huether Gottlie | $10,000 | -- | |
| Youngblood E B | $40,000 | -- | |
| Brown Bernard | $25,000 | -- | |
| First Union National Bank Of Georgia | $64,000 | -- | |
| Dotson Thomas Richard | $26,600 | -- | |
| Winkle Jerome A | $35,000 | -- | |
| Leonard W L | -- | -- |
Source: Public Records
Tax History Compared to Growth
Tax History
| Year | Tax Paid | Tax Assessment Tax Assessment Total Assessment is a certain percentage of the fair market value that is determined by local assessors to be the total taxable value of land and additions on the property. | Land | Improvement |
|---|---|---|---|---|
| 2024 | $1,863 | $48,991 | $7,747 | $41,244 |
| 2023 | $1,735 | $47,454 | $6,886 | $40,568 |
| 2022 | $1,451 | $39,775 | $5,595 | $34,180 |
| 2021 | $1,369 | $36,884 | $5,595 | $31,289 |
| 2020 | $1,286 | $34,368 | $4,304 | $30,064 |
| 2019 | $1,226 | $33,123 | $4,304 | $28,819 |
| 2018 | $1,163 | $31,427 | $4,304 | $27,123 |
| 2017 | $1,142 | $30,838 | $4,304 | $26,534 |
| 2016 | $1,134 | $30,523 | $4,280 | $26,243 |
| 2015 | $1,070 | $30,523 | $4,280 | $26,243 |
| 2014 | $1,070 | $30,523 | $4,280 | $26,243 |
Source: Public Records
Map
Nearby Homes
- 801 Maple Ave SW
- 2 Fair St SW
- 2 E 10th St SW
- 2 Coral Ave SW
- 702 River Ave SW
- 166 E 11th St SW
- 162 E 11th St SE
- 164 E 11th St SE
- 168 E 11th St SE
- 170 E 11th St SW
- 9 Eastridge Ct SW
- 31 Notasulga Dr SW
- 211 E 11th St SE
- 106 E 14th St SW
- 13 N Blanche Ave SW
- 4 E 15th St SW
- 206 E 4th St
- 1502 Spring Creek St SW
- 810 Maple Ave SW
- 812 Maple Ave SW
- 804 Maple Ave SW
- 599 Walnut Ave SW
- 601 Walnut Ave SW
- 814 Maple Ave SW
- 603 Walnut Ave SE
- 603 Walnut Ave SW
- 802 Maple Ave SW
- 816 Maple Ave SW
- 605 Walnut Ave SW
- 605 Walnut Ave SE Unit 605-609
- 6 E 6th Ave Unit 4124
- 807 Maple Ave SW
- 805 Maple Ave SW
- 607 Walnut Ave SW
- 818 Maple Ave SW
- 809 Maple Ave SW
- 803 Maple Ave SW
- 818 Maple Ave SE