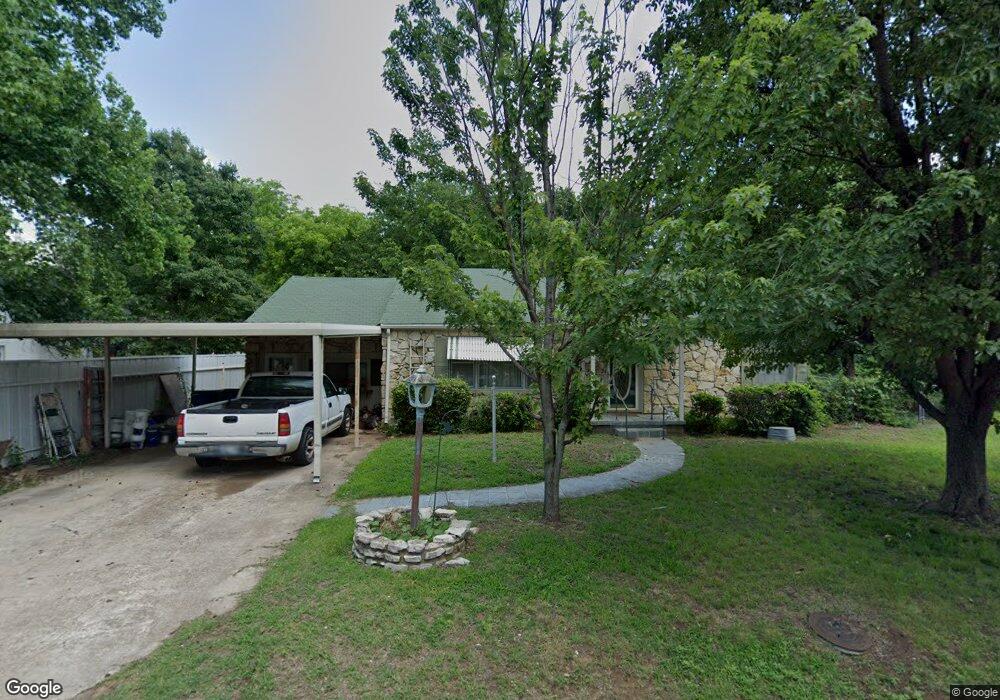
808 N 11th St Duncan, OK 73533
Estimated Value: $111,000 - $185,000
3
Beds
2
Baths
2,309
Sq Ft
$60/Sq Ft
Est. Value
About This Home
This home is located at 808 N 11th St, Duncan, OK 73533 and is currently estimated at $139,635, approximately $60 per square foot. 808 N 11th St is a home located in Stephens County with nearby schools including Emerson Elementary School, Duncan Middle School, and Duncan High School.
Ownership History
Date
Name
Owned For
Owner Type
Purchase Details
Closed on
Apr 26, 2024
Sold by
Hines Ronald Dugan
Bought by
Anthony Ralph L and Thompson Donna R
Current Estimated Value
Purchase Details
Closed on
Apr 22, 2024
Sold by
Gentry Tiffany Leigh and Hines Tiffany Leigh
Bought by
Hines Ronald Dugan
Purchase Details
Closed on
Jun 5, 2013
Sold by
Aacde Elder R and Bearday Katterne E
Bought by
Aacde Patricia Yearn
Purchase Details
Closed on
Jul 17, 2009
Sold by
Devis Patricia Jean and Grade Patricia Jean
Bought by
Gade Eldon R and Beasley Katherine E
Purchase Details
Closed on
Apr 7, 2003
Sold by
Davis Patricia
Create a Home Valuation Report for This Property
The Home Valuation Report is an in-depth analysis detailing your home's value as well as a comparison with similar homes in the area
Home Values in the Area
Average Home Value in this Area
Purchase History
| Date | Buyer | Sale Price | Title Company |
|---|---|---|---|
| Anthony Ralph L | $175,000 | First American Title | |
| Hines Ronald Dugan | -- | None Listed On Document | |
| Aacde Patricia Yearn | -- | None Available | |
| Gade Eldon R | -- | None Available | |
| -- | -- | -- |
Source: Public Records
Tax History Compared to Growth
Tax History
| Year | Tax Paid | Tax Assessment Tax Assessment Total Assessment is a certain percentage of the fair market value that is determined by local assessors to be the total taxable value of land and additions on the property. | Land | Improvement |
|---|---|---|---|---|
| 2025 | $490 | $6,038 | $515 | $5,523 |
| 2024 | $490 | $5,751 | $515 | $5,236 |
| 2023 | $490 | $5,751 | $515 | $5,236 |
| 2022 | $443 | $5,216 | $515 | $4,701 |
| 2021 | $486 | $6,708 | $268 | $6,440 |
| 2020 | $493 | $6,708 | $300 | $6,408 |
| 2019 | $494 | $6,707 | $319 | $6,388 |
| 2018 | $508 | $6,708 | $426 | $6,282 |
| 2017 | $491 | $6,708 | $426 | $6,282 |
| 2016 | $485 | $6,708 | $436 | $6,272 |
| 2015 | $500 | $6,708 | $436 | $6,272 |
| 2014 | $500 | $6,708 | $385 | $6,323 |
Source: Public Records
Map
Nearby Homes
- 810 810 N 12th St
- 1112 W Spruce St
- 1001 1001 W Hackberry
- 1213 W Pine Ave
- 1105 1105 N Grand Ave
- 1112 1112 N 12th
- 1114 N 13th St
- 815 N 14th St
- 812 N 15th St
- 1202 N Grand Blvd
- 1116 1116 W Chestnut
- 1105 W Beech Ave
- 705 705 W Hackberry Ave
- 1444 1444 N 8th St
- 805 805 N 5th
- 1312 Pkwy
- 1112 N 5th St
- 1412 N 12th St
- 1203 W Walnut Ave
- 1807 W Chisholm Dr
- 1014 W Spruce Ave
- 1014 1014 W Spruce
- 1010 W Spruce Ave
- 1015 W Cedar Ave
- 811 N 11th St
- 813 N 11th St
- 1007 W Cedar Ave
- 1008 W Spruce Ave
- 807 N 11th St
- 817 N 11th St
- 805 N 11th St
- 1006 W Spruce Ave
- 1005 W Cedar Ave
- 1103 W Cedar Ave
- 1106 W Spruce Ave
- 1106 1106 W Spruce Ave
- 1105 W Cedar Ave
- 1013 W Spruce St
- 807 N 10th St
- 805 N 10th St