Estimated Value: $80,000 - $108,000
3
Beds
2
Baths
1,136
Sq Ft
$78/Sq Ft
Est. Value
About This Home
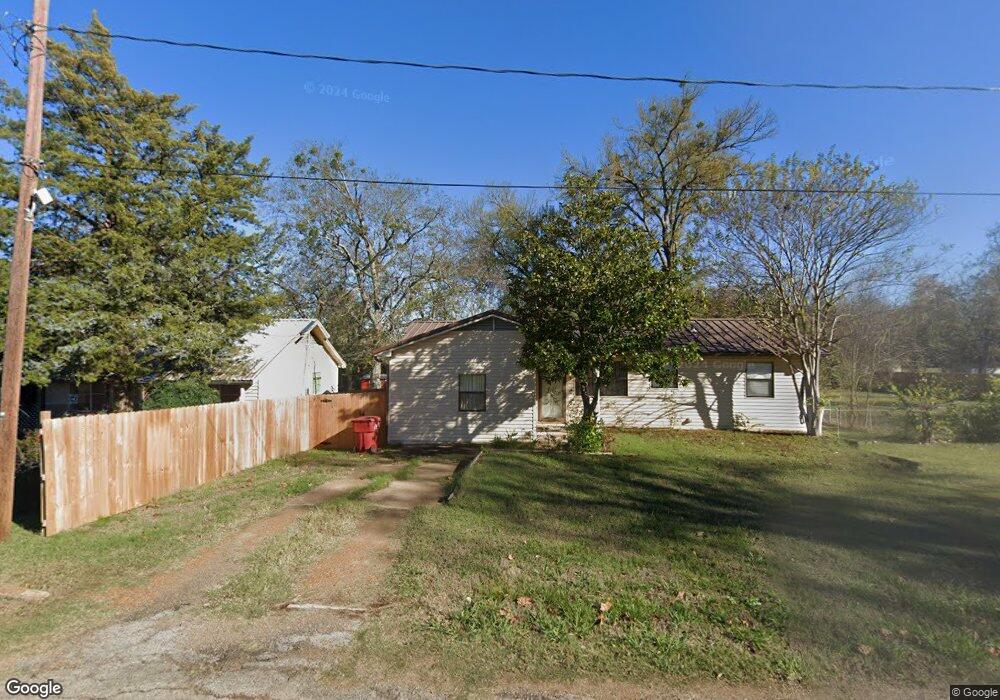
This home is located at 808 N 3rd St, Hugo, OK 74743 and is currently estimated at $88,744, approximately $78 per square foot. 808 N 3rd St is a home located in Choctaw County with nearby schools including Hugo Elementary School, Hugo Intermediate School, and Hugo Middle School.
Ownership History
Date
Name
Owned For
Owner Type
Purchase Details
Closed on
Jun 13, 2022
Sold by
Cheri Stacy
Bought by
Blundell Jeremy
Current Estimated Value
Purchase Details
Closed on
Jan 22, 2021
Sold by
Barnes Jackie Carol and Barnes Karen Danelle
Bought by
Blundell Jeremy
Home Financials for this Owner
Home Financials are based on the most recent Mortgage that was taken out on this home.
Original Mortgage
$54,000
Interest Rate
2.71%
Mortgage Type
New Conventional
Purchase Details
Closed on
May 14, 2020
Sold by
Mandrell Kenneth W and Mandrell Carolyn M
Bought by
Barnes Jackie Carol and Barnes Karen Danelle
Home Financials for this Owner
Home Financials are based on the most recent Mortgage that was taken out on this home.
Original Mortgage
$26,729
Interest Rate
3.3%
Mortgage Type
Commercial
Purchase Details
Closed on
May 5, 2017
Sold by
Williams Erin K and Williams Donald R
Bought by
Mandrell Kenneth W and Mandrell Carolyn M
Create a Home Valuation Report for This Property
The Home Valuation Report is an in-depth analysis detailing your home's value as well as a comparison with similar homes in the area
Home Values in the Area
Average Home Value in this Area
Purchase History
| Date | Buyer | Sale Price | Title Company |
|---|---|---|---|
| Blundell Jeremy | -- | None Listed On Document | |
| Blundell Jeremy | $60,000 | First American Title Ins Co | |
| Barnes Jackie Carol | $45,000 | Hugo Abstract & Title | |
| Mandrell Kenneth W | -- | None Available |
Source: Public Records
Mortgage History
| Date | Status | Borrower | Loan Amount |
|---|---|---|---|
| Previous Owner | Blundell Jeremy | $54,000 | |
| Previous Owner | Barnes Jackie Carol | $26,729 |
Source: Public Records
Tax History Compared to Growth
Tax History
| Year | Tax Paid | Tax Assessment Tax Assessment Total Assessment is a certain percentage of the fair market value that is determined by local assessors to be the total taxable value of land and additions on the property. | Land | Improvement |
|---|---|---|---|---|
| 2025 | $405 | $5,992 | $695 | $5,297 |
| 2024 | $405 | $5,818 | $330 | $5,488 |
| 2023 | $405 | $6,600 | $330 | $6,270 |
| 2022 | $537 | $6,600 | $330 | $6,270 |
| 2021 | $278 | $3,425 | $330 | $3,095 |
| 2020 | $266 | $3,262 | $330 | $2,932 |
| 2019 | $290 | $3,538 | $330 | $3,208 |
| 2018 | $276 | $3,369 | $298 | $3,071 |
| 2017 | $266 | $3,209 | $284 | $2,925 |
| 2016 | $259 | $3,056 | $270 | $2,786 |
| 2015 | $241 | $2,910 | $320 | $2,590 |
| 2014 | $209 | $2,772 | $440 | $2,332 |
Source: Public Records
Map
Nearby Homes
- 509 E Brown St
- 105 Hughes Ave
- 109 W Victor St
- 801 Nelson Dr
- 1313 Leigh St
- 307 N B St
- 405 E Brown St
- 2416 N E Rd Unit 2019RD
- 701 E Jefferson St
- 701 W Oklahoma St
- 801 W Arthur St
- 711 E Kirk St
- 805 W Clayton St
- 808 W Texas St
- 406 N J St
- 605 S 4th St
- 305 E Laurel St
- 1109 N J St
- 404 E Laurel St
- 307 E Lowery St