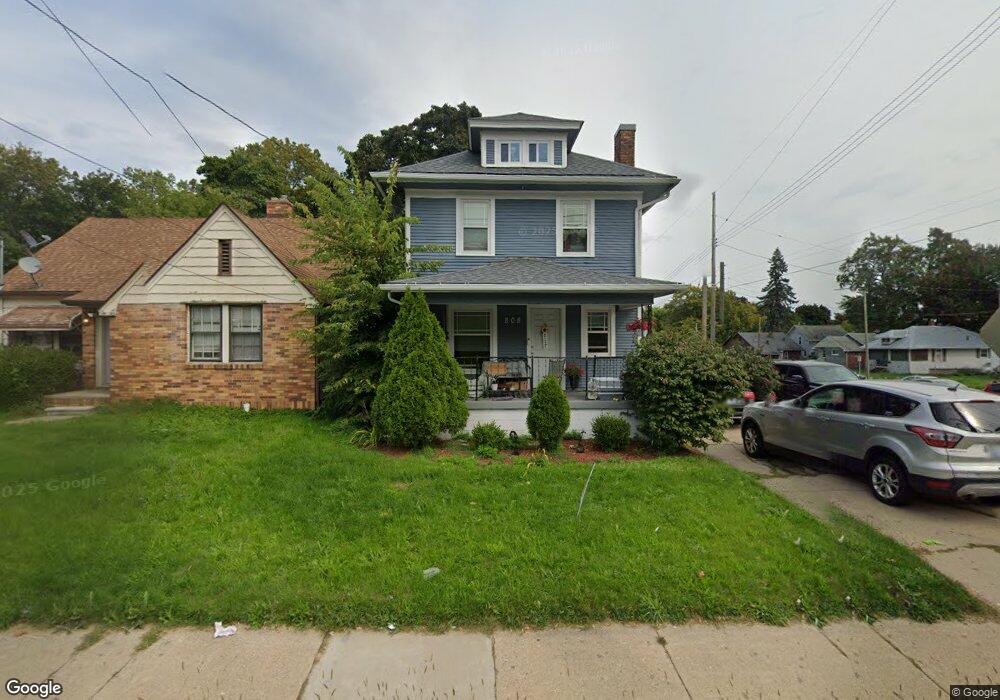
808 N Mlk Blvd Lansing, MI 48915
Old Forest NeighborhoodEstimated Value: $122,000 - $141,400
--
Bed
--
Bath
1,254
Sq Ft
$104/Sq Ft
Est. Value
About This Home
This home is located at 808 N Mlk Blvd, Lansing, MI 48915 and is currently estimated at $130,350, approximately $103 per square foot. 808 N Mlk Blvd is a home located in Ingham County with nearby schools including Willow School, Pattengill Academy, and J.W. Sexton High School.
Ownership History
Date
Name
Owned For
Owner Type
Purchase Details
Closed on
Oct 7, 2024
Sold by
Bowie Morgan
Bought by
Estrada Briana Larey and Estrada Emmanuel
Current Estimated Value
Home Financials for this Owner
Home Financials are based on the most recent Mortgage that was taken out on this home.
Original Mortgage
$116,850
Outstanding Balance
$115,622
Interest Rate
6.35%
Mortgage Type
New Conventional
Estimated Equity
$14,728
Purchase Details
Closed on
Apr 23, 2021
Sold by
Gridiron Marketing Group Llc
Bought by
Bowie Morgan
Home Financials for this Owner
Home Financials are based on the most recent Mortgage that was taken out on this home.
Original Mortgage
$8,640,600
Interest Rate
3%
Mortgage Type
FHA
Purchase Details
Closed on
Jun 17, 2020
Sold by
Cantu Roderick
Bought by
Gridiron Marketing Group Llc
Purchase Details
Closed on
Feb 12, 2015
Sold by
Stump Michael J and Stump Patrick
Bought by
Cantu Roderick
Purchase Details
Closed on
Dec 4, 2014
Sold by
Stump Michael J
Bought by
Stump Michael J and Stump Patrick
Create a Home Valuation Report for This Property
The Home Valuation Report is an in-depth analysis detailing your home's value as well as a comparison with similar homes in the area
Home Values in the Area
Average Home Value in this Area
Purchase History
| Date | Buyer | Sale Price | Title Company |
|---|---|---|---|
| Estrada Briana Larey | $123,000 | Transnation Title | |
| Bowie Morgan | $88,000 | Ata National Title Group Llc | |
| Gridiron Marketing Group Llc | $25,000 | Transnation Title Agency | |
| Cantu Roderick | $15,000 | Tri County Title Agency Llc | |
| Stump Michael J | -- | None Available |
Source: Public Records
Mortgage History
| Date | Status | Borrower | Loan Amount |
|---|---|---|---|
| Open | Estrada Briana Larey | $116,850 | |
| Previous Owner | Bowie Morgan | $8,640,600 |
Source: Public Records
Tax History Compared to Growth
Tax History
| Year | Tax Paid | Tax Assessment Tax Assessment Total Assessment is a certain percentage of the fair market value that is determined by local assessors to be the total taxable value of land and additions on the property. | Land | Improvement |
|---|---|---|---|---|
| 2025 | $3,011 | $46,100 | $4,700 | $41,400 |
| 2024 | $24 | $49,900 | $4,700 | $45,200 |
| 2023 | $2,823 | $44,500 | $4,700 | $39,800 |
| 2022 | $2,545 | $41,400 | $4,500 | $36,900 |
| 2021 | $2,346 | $37,600 | $3,100 | $34,500 |
| 2020 | $2,578 | $33,400 | $3,100 | $30,300 |
| 2019 | $3,991 | $31,200 | $3,100 | $28,100 |
| 2018 | $1,864 | $31,100 | $3,100 | $28,000 |
| 2017 | $1,784 | $31,100 | $3,100 | $28,000 |
| 2016 | $1,434 | $30,500 | $3,100 | $27,400 |
| 2015 | $1,434 | $29,600 | $6,144 | $23,456 |
| 2014 | $1,434 | $29,900 | $12,000 | $17,900 |
Source: Public Records
Map
Nearby Homes
- 814 N Martin Luther King jr Blvd
- 908 Clyde St
- 1019 Daleford St
- 806 Princeton Ave
- 820 Princeton Ave
- 754 Princeton Ave
- 751 Chicago Ave
- 705 Princeton Ave
- 1217 W Saginaw St
- 1221 W Saginaw St
- 1225 W Saginaw St
- 1229 W Saginaw St
- 751 Westmoreland Ave
- 1129 N Martin Luther King jr Blvd
- 1300 W Maple St
- 1310 W Maple St
- 921 N Sycamore St
- 531 N Butler Blvd
- 819 N Jenison Ave
- 732 W Lapeer St
- 808 N Martin Luther King jr Blvd
- 808 N Martin Luther King Junior Blvd
- 810 N Martin Luther King jr Blvd
- 810 N Martin Luther King Junior Blvd
- 810 N Mlk Blvd
- 1014 W Oakland Ave
- 814 N Mlk Blvd
- 820 N Mlk Blvd
- 752 N Mlk Blvd
- 813 N Martin Luther King jr Blvd
- 807 Princeton Ave
- 1019 W Oakland Ave
- 824 N M l King jr Blvd
- 817 N Martin Luther King jr Blvd
- 824 N Mlk Blvd
- 815 Princeton Ave
- 821 Princeton Ave
- 828 N Mlk Blvd
- 1011 W Oakland Ave
- 819 N Mlk Blvd