Estimated Value: $162,000 - $172,105
3
Beds
2
Baths
1,080
Sq Ft
$155/Sq Ft
Est. Value
About This Home
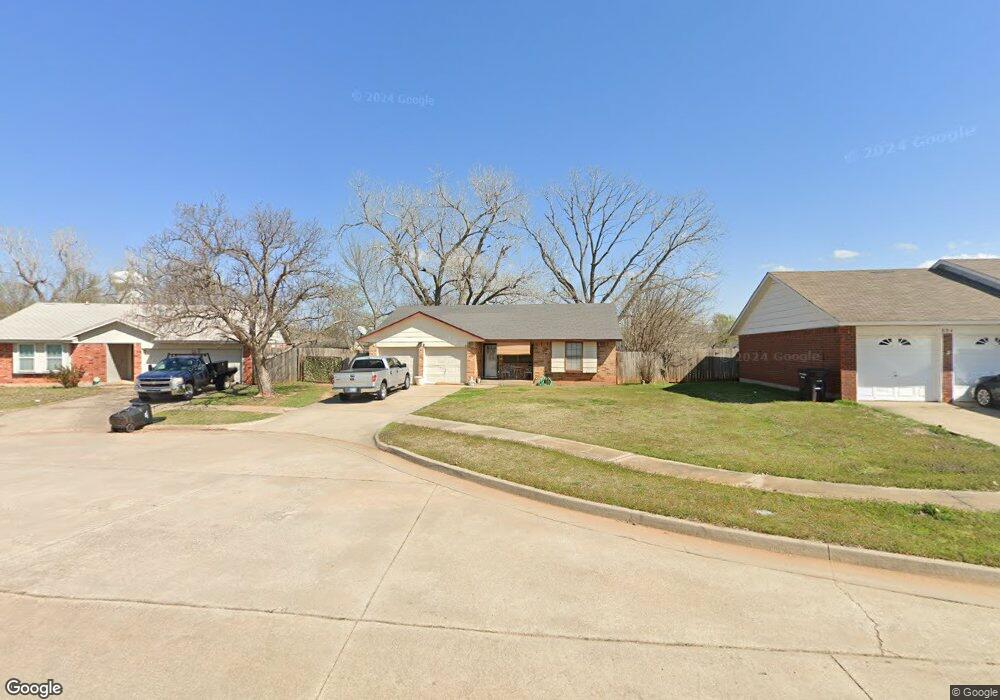
This home is located at 808 N Ramblin Oaks Dr, Moore, OK 73160 and is currently estimated at $167,276, approximately $154 per square foot. 808 N Ramblin Oaks Dr is a home located in Cleveland County with nearby schools including Winding Creek Elementary School, Central Junior High School, and Moore High School.
Ownership History
Date
Name
Owned For
Owner Type
Purchase Details
Closed on
Sep 30, 2009
Sold by
Wendte Tyler R and Wendte Mike
Bought by
Cannady Dalbert
Current Estimated Value
Home Financials for this Owner
Home Financials are based on the most recent Mortgage that was taken out on this home.
Original Mortgage
$94,751
Outstanding Balance
$60,731
Interest Rate
5.12%
Mortgage Type
FHA
Estimated Equity
$106,545
Purchase Details
Closed on
Apr 13, 2007
Sold by
Buckmaster Billy and Buckmaster Marsha
Bought by
Wendte Tyler R and Wendte Mike
Home Financials for this Owner
Home Financials are based on the most recent Mortgage that was taken out on this home.
Original Mortgage
$91,806
Interest Rate
6.19%
Mortgage Type
FHA
Purchase Details
Closed on
Sep 10, 2004
Sold by
Lynch Chace and Lynch Robert
Bought by
Buckmaster Billy and Wendte Marsha
Purchase Details
Closed on
Jan 15, 2004
Sold by
Varghese Gracy P Varghese Thomas K
Bought by
Lynch Chace and Lynch Robert
Create a Home Valuation Report for This Property
The Home Valuation Report is an in-depth analysis detailing your home's value as well as a comparison with similar homes in the area
Home Values in the Area
Average Home Value in this Area
Purchase History
| Date | Buyer | Sale Price | Title Company |
|---|---|---|---|
| Cannady Dalbert | $96,500 | Agt | |
| Wendte Tyler R | $93,500 | None Available | |
| Buckmaster Billy | $79,000 | -- | |
| Lynch Chace | $71,500 | -- |
Source: Public Records
Mortgage History
| Date | Status | Borrower | Loan Amount |
|---|---|---|---|
| Open | Cannady Dalbert | $94,751 | |
| Previous Owner | Wendte Tyler R | $91,806 |
Source: Public Records
Tax History
| Year | Tax Paid | Tax Assessment Tax Assessment Total Assessment is a certain percentage of the fair market value that is determined by local assessors to be the total taxable value of land and additions on the property. | Land | Improvement |
|---|---|---|---|---|
| 2025 | $1,593 | $13,007 | $2,983 | $10,024 |
| 2023 | $1,438 | $11,798 | $2,980 | $8,818 |
| 2022 | $1,390 | $11,236 | $3,010 | $8,226 |
| 2021 | $1,331 | $10,701 | $2,400 | $8,301 |
| 2020 | $1,331 | $10,701 | $2,400 | $8,301 |
| 2019 | $1,355 | $10,701 | $2,400 | $8,301 |
| 2018 | $1,356 | $10,701 | $2,400 | $8,301 |
| 2017 | $1,362 | $10,701 | $0 | $0 |
| 2016 | $1,372 | $10,701 | $2,400 | $8,301 |
| 2015 | $1,224 | $10,554 | $2,367 | $8,187 |
| 2014 | $1,194 | $10,051 | $1,347 | $8,704 |
Source: Public Records
Map
Nearby Homes
- 1101 Bronze Medal Rd
- 1401 NE 11th St
- 625 Champion Ln
- 0 NE 12th St
- 617 Randall Dr
- 1124 NE 8th St
- 1013 Oak Creek Dr
- 1105 Oak Creek Dr
- 1404 Old Mill Rd
- 1824 NE 11th St
- 217 N Morgan Dr
- 221 N English Dr
- 1109 E Hills Dr
- 1508 Sequoyah Ave
- 1521 NE 1st St
- 620 Allison Ln
- 112 Wellington Ln
- 1317 Washington Cir
- 904 NE 17th St
- 707 Crestmoor Dr
- 804 N Ramblin Oaks Dr
- 812 N Ramblin Oaks Dr
- 813 N Ramblin Oaks Dr
- 800 N Ramblin Oaks Dr
- 809 N Ramblin Oaks Dr
- 817 N Ramblin Oaks Dr
- 805 N Ramblin Oaks Dr
- 716 N Ramblin Oaks Dr
- 801 N Ramblin Oaks Dr
- 933 Bronze Medal Rd
- 1001 Bronze Medal Rd
- 929 Bronze Medal Rd
- 1012 Summer Hill Dr
- 1005 Bronze Medal Rd
- 925 Bronze Medal Rd
- 715 N Ramblin Oaks Dr
- 1008 Summerhill Dr
- 712 N Ramblin Oaks Dr
- 824 N Morgan Dr
- 1009 Bronze Medal Rd
Your Personal Tour Guide
Ask me questions while you tour the home.