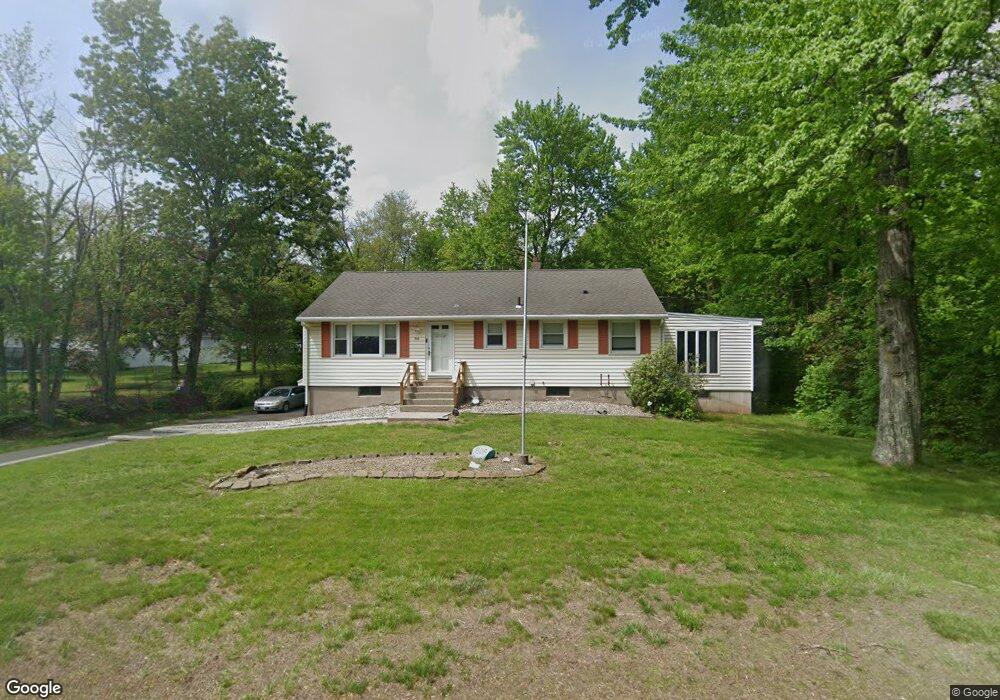
808 North St Feeding Hills, MA 01030
Estimated Value: $353,954 - $378,000
3
Beds
1
Bath
1,456
Sq Ft
$250/Sq Ft
Est. Value
About This Home
This home is located at 808 North St, Feeding Hills, MA 01030 and is currently estimated at $363,989, approximately $249 per square foot. 808 North St is a home located in Hampden County with nearby schools including Agawam Junior High School, Agawam High School, and St Thomas The Apostle School.
Ownership History
Date
Name
Owned For
Owner Type
Purchase Details
Closed on
May 23, 2017
Sold by
Schuler Raymond C
Bought by
Schuler Pamela A
Current Estimated Value
Purchase Details
Closed on
Jul 25, 2006
Sold by
Cinella Lynne V and Cinella Peter J
Bought by
Schuler Pamela A and Schuler Raymond C
Home Financials for this Owner
Home Financials are based on the most recent Mortgage that was taken out on this home.
Original Mortgage
$180,000
Interest Rate
6.67%
Mortgage Type
Purchase Money Mortgage
Purchase Details
Closed on
Nov 30, 2001
Sold by
Moore Dorothy J Est
Bought by
Cinella Peter J and Cinella Lynne
Home Financials for this Owner
Home Financials are based on the most recent Mortgage that was taken out on this home.
Original Mortgage
$131,400
Interest Rate
6.66%
Mortgage Type
Purchase Money Mortgage
Create a Home Valuation Report for This Property
The Home Valuation Report is an in-depth analysis detailing your home's value as well as a comparison with similar homes in the area
Home Values in the Area
Average Home Value in this Area
Purchase History
| Date | Buyer | Sale Price | Title Company |
|---|---|---|---|
| Schuler Pamela A | -- | -- | |
| Schuler Pamela A | $225,000 | -- | |
| Cinella Peter J | $146,000 | -- |
Source: Public Records
Mortgage History
| Date | Status | Borrower | Loan Amount |
|---|---|---|---|
| Previous Owner | Schuler Pamela A | $180,000 | |
| Previous Owner | Schuler Pamela A | $45,000 | |
| Previous Owner | Cinella Peter J | $131,400 | |
| Previous Owner | Cinella Peter J | $45,000 |
Source: Public Records
Tax History Compared to Growth
Tax History
| Year | Tax Paid | Tax Assessment Tax Assessment Total Assessment is a certain percentage of the fair market value that is determined by local assessors to be the total taxable value of land and additions on the property. | Land | Improvement |
|---|---|---|---|---|
| 2025 | $4,492 | $306,800 | $113,100 | $193,700 |
| 2024 | $4,398 | $302,500 | $113,100 | $189,400 |
| 2023 | $4,194 | $265,800 | $101,900 | $163,900 |
| 2022 | $4,028 | $250,000 | $101,900 | $148,100 |
| 2021 | $3,736 | $222,400 | $88,000 | $134,400 |
| 2020 | $3,650 | $216,900 | $86,500 | $130,400 |
| 2019 | $3,536 | $212,400 | $84,600 | $127,800 |
| 2018 | $3,294 | $198,300 | $80,200 | $118,100 |
| 2017 | $3,128 | $191,800 | $80,200 | $111,600 |
| 2016 | $3,061 | $189,200 | $80,200 | $109,000 |
| 2015 | $2,896 | $184,000 | $80,200 | $103,800 |
Source: Public Records
Map
Nearby Homes
- 60 Elizabeth St
- 157 Cambridge St
- 4 Liquori Dr
- 999 N Street Extension
- 92 Juniper Ridge Dr
- 200 Anvil St
- 1085 N Street Extension
- lot A North St
- 94 Witheridge St
- 8 Ridgeview Dr
- 67 Colemore St
- 7 Agnoli Place
- 416 Hillcrest Ave
- 122 Southwick St
- 691 Mill St
- 309 Poplar St
- 258 Poplar Ave
- 719 N West St
- 36-38 Orlando St
- 148 Craiwell Ave