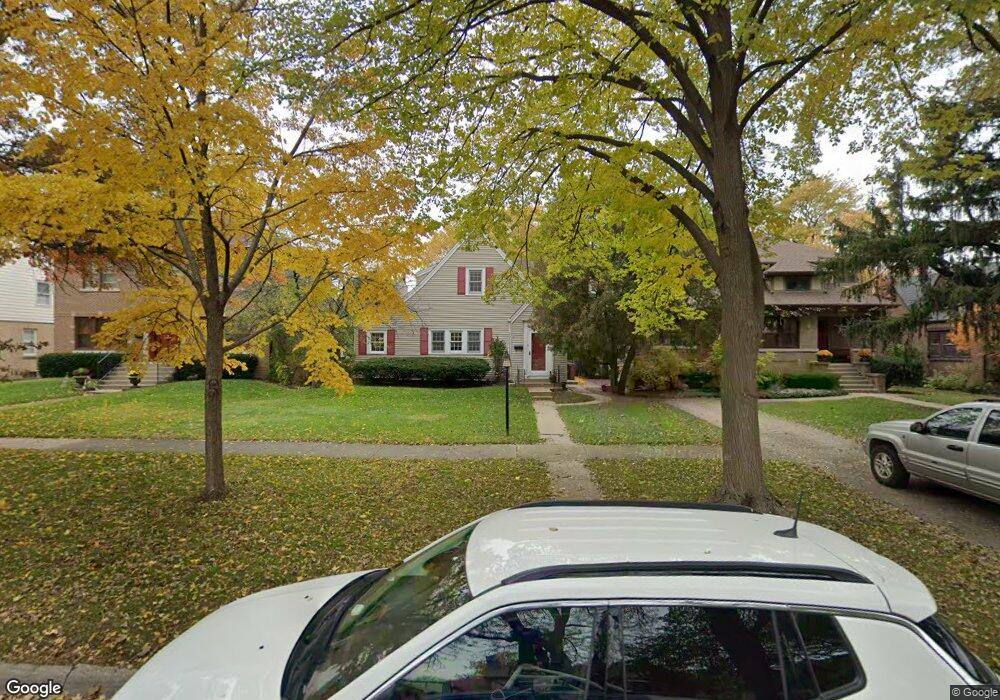
808 S Crescent Ave Park Ridge, IL 60068
Estimated Value: $626,000 - $791,000
4
Beds
4
Baths
2,277
Sq Ft
$309/Sq Ft
Est. Value
About This Home
This home is located at 808 S Crescent Ave, Park Ridge, IL 60068 and is currently estimated at $704,357, approximately $309 per square foot. 808 S Crescent Ave is a home located in Cook County with nearby schools including Theodore Roosevelt Elementary School, Lincoln Middle School, and Maine South High School.
Ownership History
Date
Name
Owned For
Owner Type
Purchase Details
Closed on
May 24, 2000
Sold by
Montanile Susan
Bought by
Sulek Thomas J and Sulek Lisa A
Current Estimated Value
Home Financials for this Owner
Home Financials are based on the most recent Mortgage that was taken out on this home.
Original Mortgage
$91,000
Outstanding Balance
$30,826
Interest Rate
7.87%
Estimated Equity
$673,531
Purchase Details
Closed on
Jul 28, 1998
Sold by
Cowan William H and Cowan Grace E M
Bought by
Montanile Susan
Home Financials for this Owner
Home Financials are based on the most recent Mortgage that was taken out on this home.
Original Mortgage
$125,000
Interest Rate
6.87%
Purchase Details
Closed on
Dec 1, 1994
Sold by
Dejulio Vincent R and Dejulio Carol M
Bought by
Cowan William H and Cowan Grace E M
Home Financials for this Owner
Home Financials are based on the most recent Mortgage that was taken out on this home.
Original Mortgage
$180,000
Interest Rate
3.75%
Create a Home Valuation Report for This Property
The Home Valuation Report is an in-depth analysis detailing your home's value as well as a comparison with similar homes in the area
Home Values in the Area
Average Home Value in this Area
Purchase History
| Date | Buyer | Sale Price | Title Company |
|---|---|---|---|
| Sulek Thomas J | $310,000 | -- | |
| Montanile Susan | $289,000 | -- | |
| Cowan William H | $235,000 | -- |
Source: Public Records
Mortgage History
| Date | Status | Borrower | Loan Amount |
|---|---|---|---|
| Open | Sulek Thomas J | $91,000 | |
| Previous Owner | Montanile Susan | $125,000 | |
| Previous Owner | Cowan William H | $180,000 |
Source: Public Records
Tax History Compared to Growth
Tax History
| Year | Tax Paid | Tax Assessment Tax Assessment Total Assessment is a certain percentage of the fair market value that is determined by local assessors to be the total taxable value of land and additions on the property. | Land | Improvement |
|---|---|---|---|---|
| 2024 | $14,861 | $54,757 | $15,045 | $39,712 |
| 2023 | $12,639 | $54,757 | $15,045 | $39,712 |
| 2022 | $12,639 | $54,757 | $15,045 | $39,712 |
| 2021 | $14,571 | $47,907 | $9,292 | $38,615 |
| 2020 | $13,992 | $47,907 | $9,292 | $38,615 |
| 2019 | $13,721 | $52,646 | $9,292 | $43,354 |
| 2018 | $12,550 | $47,289 | $7,965 | $39,324 |
| 2017 | $12,513 | $47,289 | $7,965 | $39,324 |
| 2016 | $12,290 | $47,289 | $7,965 | $39,324 |
| 2015 | $13,837 | $47,488 | $6,637 | $40,851 |
| 2014 | $13,581 | $47,488 | $6,637 | $40,851 |
| 2013 | $12,847 | $47,488 | $6,637 | $40,851 |
Source: Public Records
Map
Nearby Homes
- 623 S Prospect Ave
- 718 S Washington Ave
- 819 Albion Ave
- 820 W Talcott Rd
- 1220 Courtland Ave
- 301 S Prospect Ave
- 1021 Cleveland Ave
- 316 S Fairview Ave
- 249 S Vine Ave Unit B
- 1116 S Cumberland Ave
- 1016 Arthur St
- 428 S Clifton Ave
- 919 S Chester Ave
- 1015 Arthur St
- 901 S Cumberland Ave
- 400 S Northwest Hwy Unit 312B
- 460 S Northwest Hwy Unit 307A
- 1014 S Chester Ave
- 6852 N Northwest Hwy Unit 2B
- 6858 N Northwest Hwy Unit 2E
- 812 S Crescent Ave
- 804 S Crescent Ave
- 800 S Crescent Ave
- 816 S Crescent Ave
- 820 S Crescent Ave
- 732 S Crescent Ave
- 809 Courtland Ave
- 824 S Crescent Ave
- 805 Courtland Ave
- 813 Courtland Ave
- 728 S Crescent Ave
- 817 Courtland Ave
- 801 Courtland Ave
- 823 Courtland Ave
- 828 S Crescent Ave
- 724 S Crescent Ave
- 807 S Crescent Ave
- 811 S Crescent Ave
- 803 S Crescent Ave
- 815 S Crescent Ave