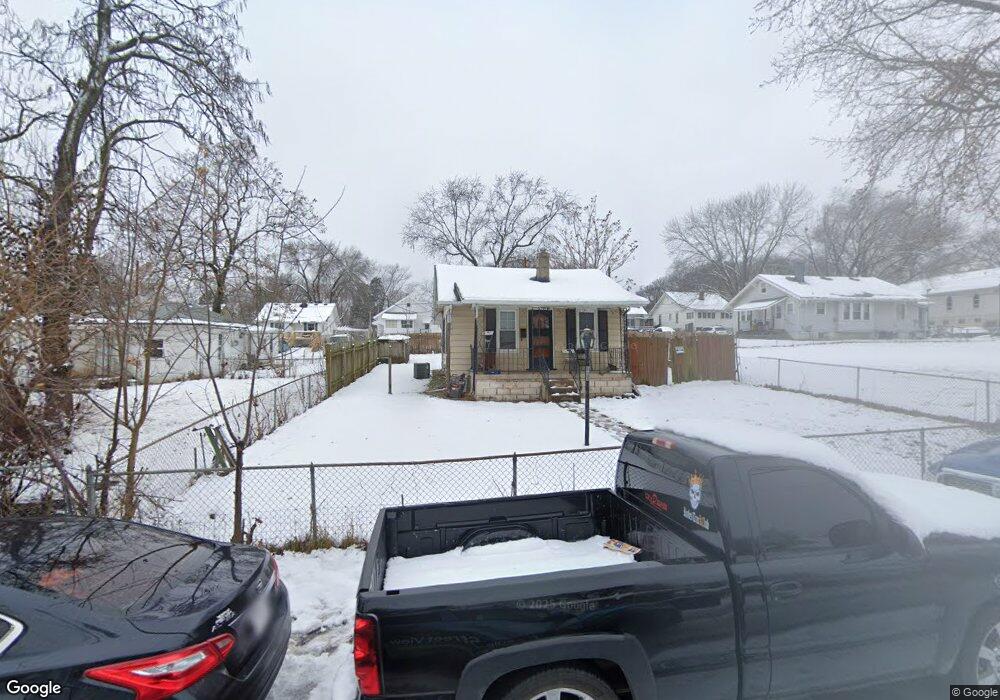
808 S Marion Ave Independence, MO 64052
Heart of Independence NeighborhoodEstimated Value: $81,546 - $97,000
1
Bed
1
Bath
630
Sq Ft
$143/Sq Ft
Est. Value
About This Home
This home is located at 808 S Marion Ave, Independence, MO 64052 and is currently estimated at $89,887, approximately $142 per square foot. 808 S Marion Ave is a home located in Jackson County with nearby schools including Santa Fe Trail Elementary School, Bridger Middle School, and Bingham Middle School.
Ownership History
Date
Name
Owned For
Owner Type
Purchase Details
Closed on
Jul 17, 2017
Sold by
Ronald G Bruch Trust
Bought by
John W Shinn & Ruby M Shinn Revocable Li
Current Estimated Value
Purchase Details
Closed on
Jul 14, 2010
Sold by
Templeton Howard E and Templeton Sharon R
Bought by
Ronald G Bruch Trust
Purchase Details
Closed on
Feb 18, 2010
Sold by
Secretary Of Housing & Urban Development
Bought by
Templeton Howard E and Templeton Sharon R
Purchase Details
Closed on
Aug 11, 2009
Sold by
Dalton Karen
Bought by
Bac Home Loans Servicing Lp and Countrywide Home Loans Servicing Lp
Purchase Details
Closed on
Aug 19, 2004
Sold by
Widick Leona
Bought by
Dalton Karen
Home Financials for this Owner
Home Financials are based on the most recent Mortgage that was taken out on this home.
Original Mortgage
$49,227
Interest Rate
6.02%
Mortgage Type
FHA
Create a Home Valuation Report for This Property
The Home Valuation Report is an in-depth analysis detailing your home's value as well as a comparison with similar homes in the area
Home Values in the Area
Average Home Value in this Area
Purchase History
| Date | Buyer | Sale Price | Title Company |
|---|---|---|---|
| John W Shinn & Ruby M Shinn Revocable Li | $20,000 | None Available | |
| Ronald G Bruch Trust | -- | Chicago | |
| Templeton Howard E | -- | None Available | |
| Bac Home Loans Servicing Lp | $51,099 | None Available | |
| Dalton Karen | -- | Assured Quality Title Co |
Source: Public Records
Mortgage History
| Date | Status | Borrower | Loan Amount |
|---|---|---|---|
| Previous Owner | Dalton Karen | $49,227 |
Source: Public Records
Tax History
| Year | Tax Paid | Tax Assessment Tax Assessment Total Assessment is a certain percentage of the fair market value that is determined by local assessors to be the total taxable value of land and additions on the property. | Land | Improvement |
|---|---|---|---|---|
| 2025 | $601 | $8,292 | $3,481 | $4,811 |
| 2024 | $587 | $8,675 | $1,967 | $6,708 |
| 2023 | $587 | $8,676 | $1,294 | $7,382 |
| 2022 | $463 | $6,270 | $1,500 | $4,770 |
| 2021 | $463 | $6,270 | $1,500 | $4,770 |
| 2020 | $452 | $5,948 | $1,500 | $4,448 |
| 2019 | $445 | $5,948 | $1,500 | $4,448 |
| 2018 | $405 | $5,176 | $1,305 | $3,871 |
| 2017 | $405 | $5,176 | $1,305 | $3,871 |
| 2016 | $356 | $4,501 | $1,370 | $3,131 |
Source: Public Records
Map
Nearby Homes
- 811 S Marion Ave
- 709 S Willis Ave
- 724 S Grand Ave
- 1500 W Lexington Ave
- 712 W 23rd St S
- 1511 W 23rd St S
- 11610 E Ivanhoe Ct
- 611 W 23rd St
- 1110 W 24th St S
- 1358 S Delaware Ave
- 1701 W Walnut St
- 1215 S Pleasant St
- 1230 W 25th St S
- 1613 S Norwood Ave
- 1209 S Spring St
- 11432 E 17th St S
- 11424 E 17th St S
- 1419 W Maple Ave
- 1113 W 25th Terrace S
- 2316 S Vermont Ave
- 812 S Marion Ave
- 1227 W Linden Ave
- 1233 W Linden Ave
- 820 S Marion Ave
- 811 S Crysler Ave
- 1217 W Linden Ave
- 813 S Crysler Ave
- 809 S Marion Ave
- 1215 W Linden Ave
- 805 S Crysler Ave
- 1226 W Sea Ave
- 801 S Crysler Ave
- 817 S Crysler Ave
- 1228 W Linden Ave
- 1224 W Linden Ave
- 1209 W Linden Ave
- 823 S Marion Ave
- 825 S Marion Ave
- 825 S Crysler Ave
- 1220 W Linden Ave
Your Personal Tour Guide
Ask me questions while you tour the home.