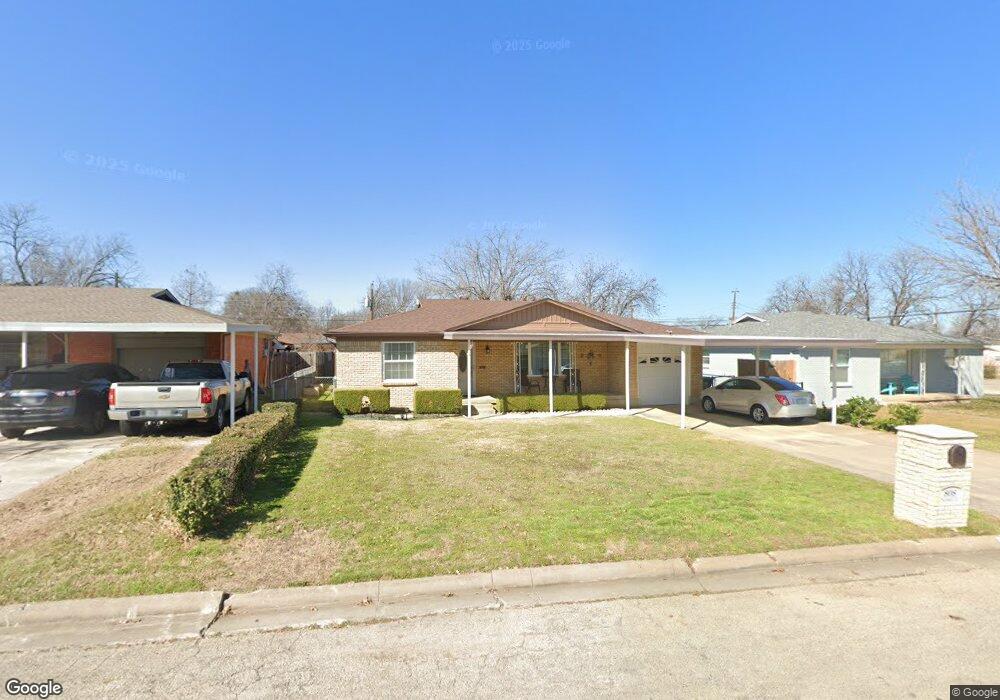
808 Sandell Dr Fort Worth, TX 76108
Estimated Value: $218,000 - $225,000
3
Beds
2
Baths
1,278
Sq Ft
$174/Sq Ft
Est. Value
About This Home
This home is located at 808 Sandell Dr, Fort Worth, TX 76108 and is currently estimated at $221,948, approximately $173 per square foot. 808 Sandell Dr is a home located in Tarrant County with nearby schools including Liberty Elementary School, Brewer Middle School, and Tannahill Intermediate School.
Ownership History
Date
Name
Owned For
Owner Type
Purchase Details
Closed on
Jul 29, 2009
Sold by
Corralejo Victor M
Bought by
Corralejo Maria Jovita
Current Estimated Value
Purchase Details
Closed on
May 23, 2001
Sold by
Pennington Jamie Loy and Pennington Gwendola Mae
Bought by
Corralejo Victor M
Home Financials for this Owner
Home Financials are based on the most recent Mortgage that was taken out on this home.
Original Mortgage
$65,964
Interest Rate
6.98%
Create a Home Valuation Report for This Property
The Home Valuation Report is an in-depth analysis detailing your home's value as well as a comparison with similar homes in the area
Home Values in the Area
Average Home Value in this Area
Purchase History
| Date | Buyer | Sale Price | Title Company |
|---|---|---|---|
| Corralejo Maria Jovita | -- | None Available | |
| Corralejo Victor M | -- | Commonwealth Land Title |
Source: Public Records
Mortgage History
| Date | Status | Borrower | Loan Amount |
|---|---|---|---|
| Previous Owner | Corralejo Victor M | $65,964 |
Source: Public Records
Tax History Compared to Growth
Tax History
| Year | Tax Paid | Tax Assessment Tax Assessment Total Assessment is a certain percentage of the fair market value that is determined by local assessors to be the total taxable value of land and additions on the property. | Land | Improvement |
|---|---|---|---|---|
| 2025 | $2,158 | $205,091 | $44,825 | $160,266 |
| 2024 | $2,158 | $205,091 | $44,825 | $160,266 |
| 2023 | $3,374 | $215,982 | $44,825 | $171,157 |
| 2022 | $3,494 | $163,428 | $25,000 | $138,428 |
| 2021 | $3,226 | $148,787 | $25,000 | $123,787 |
| 2020 | $2,954 | $120,308 | $25,000 | $95,308 |
| 2019 | $2,788 | $117,519 | $25,000 | $92,519 |
| 2018 | $2,020 | $88,112 | $12,000 | $76,112 |
| 2017 | $2,341 | $84,972 | $12,000 | $72,972 |
| 2016 | $2,128 | $82,460 | $12,000 | $70,460 |
| 2015 | $1,579 | $66,200 | $10,000 | $56,200 |
| 2014 | $1,579 | $66,200 | $10,000 | $56,200 |
Source: Public Records
Map
Nearby Homes