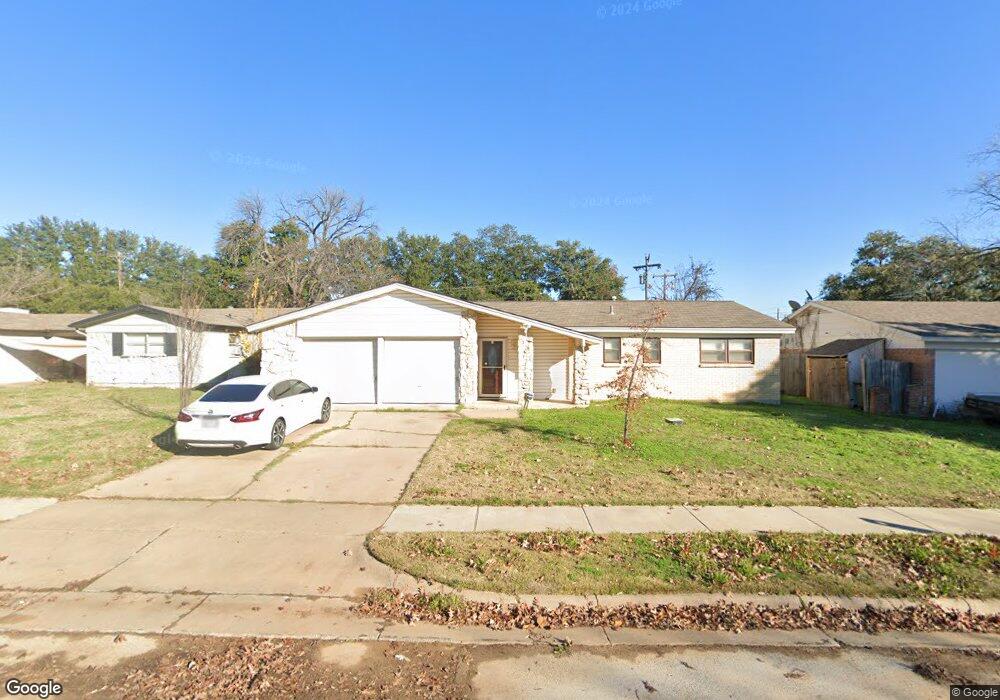
808 Savannah Way Bedford, TX 76022
Estimated Value: $308,381 - $345,000
3
Beds
2
Baths
1,470
Sq Ft
$221/Sq Ft
Est. Value
About This Home
This home is located at 808 Savannah Way, Bedford, TX 76022 and is currently estimated at $325,345, approximately $221 per square foot. 808 Savannah Way is a home located in Tarrant County with nearby schools including Bell Manor Elementary School, Central J High School, and Trinity High School.
Ownership History
Date
Name
Owned For
Owner Type
Purchase Details
Closed on
Dec 9, 2019
Sold by
Maudlin Ronald Walton and Bosma Romaine E
Bought by
Tran Thach Thi
Current Estimated Value
Purchase Details
Closed on
Nov 15, 2019
Sold by
Tran Thach Thi
Bought by
Mauldin Ngoc
Purchase Details
Closed on
Mar 16, 2015
Sold by
Mauldin Ronald Walton and Mauldin Bosma Romaine Elaine
Bought by
Tran Thach Thi
Purchase Details
Closed on
Sep 3, 2003
Sold by
Mauldin Mildred D
Bought by
Mauldin Ronald Walton and Bosma Romaine E
Purchase Details
Closed on
Aug 30, 1993
Sold by
Sarjak Enterprises Inc
Bought by
Mauldin Ronald W and Mauldin Lorelei P
Home Financials for this Owner
Home Financials are based on the most recent Mortgage that was taken out on this home.
Original Mortgage
$16,000
Interest Rate
7.18%
Create a Home Valuation Report for This Property
The Home Valuation Report is an in-depth analysis detailing your home's value as well as a comparison with similar homes in the area
Home Values in the Area
Average Home Value in this Area
Purchase History
| Date | Buyer | Sale Price | Title Company |
|---|---|---|---|
| Tran Thach Thi | -- | None Available | |
| Mauldin Ngoc | -- | None Available | |
| Tran Thach Thi | -- | None Available | |
| Mauldin Ronald Walton | -- | -- | |
| Mauldin Ronald W | -- | Lawyers American Title Co |
Source: Public Records
Mortgage History
| Date | Status | Borrower | Loan Amount |
|---|---|---|---|
| Previous Owner | Mauldin Ronald W | $16,000 |
Source: Public Records
Tax History Compared to Growth
Tax History
| Year | Tax Paid | Tax Assessment Tax Assessment Total Assessment is a certain percentage of the fair market value that is determined by local assessors to be the total taxable value of land and additions on the property. | Land | Improvement |
|---|---|---|---|---|
| 2025 | $1,721 | $280,328 | $65,000 | $215,328 |
| 2024 | $1,721 | $280,328 | $65,000 | $215,328 |
| 2023 | $1,773 | $260,439 | $45,000 | $215,439 |
| 2022 | $4,084 | $247,114 | $45,000 | $202,114 |
| 2021 | $4,005 | $170,000 | $45,000 | $125,000 |
| 2020 | $4,220 | $177,500 | $45,000 | $132,500 |
| 2019 | $3,993 | $183,818 | $45,000 | $138,818 |
| 2018 | $2,479 | $149,410 | $23,000 | $126,410 |
| 2017 | $3,286 | $135,827 | $23,000 | $112,827 |
| 2016 | $2,597 | $121,850 | $23,000 | $98,850 |
| 2015 | -- | $97,600 | $18,000 | $79,600 |
| 2014 | -- | $97,600 | $18,000 | $79,600 |
Source: Public Records
Map
Nearby Homes
- 804 Natchez Ave
- 952 Charleston Dr
- 933 Charleston Ct
- 2101 Gettysburg Place
- 2024 Charleston Dr
- 808 Gregory Ave
- 828 Gregory Ave
- 1613 Trinity Ct
- 1604 Richmond Dr
- 800 Prestwick St
- 1216 Princeton Place
- 1049 Stableway Ln
- 1701 Winchester Way
- 2201 Greendale Ct
- 1213 Greendale Dr
- 2025 Schumac Ln
- 2420 Dalewood Ln
- 1116 Highpoint Rd
- 904 Nelson Terrace
- 2620 Britany Cir
- 804 Savannah Way
- 810 Savannah Way
- 800 Savannah Way
- 814 Savannah Way
- 809 Savannah Way
- 805 Savannah Way
- 813 Savannah Way
- 818 Savannah Way
- 801 Savannah Way
- 817 Savannah Way
- 821 Savannah Way
- 824 Savannah Way
- 808 Natchez Ave
- 812 Natchez Ave
- 800 Natchez Ave
- 816 Natchez Ave
- 820 Natchez Ave
- 825 Savannah Way
- 1900 Natchez Ave
- 1904 Natchez Ave