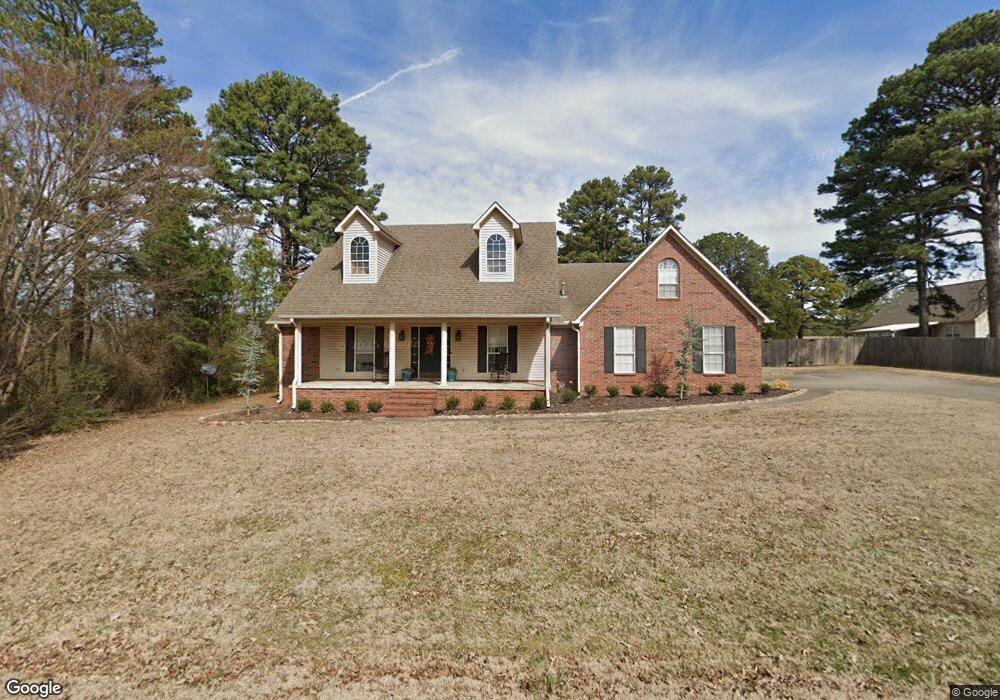
808 Summer Trail Dr Heber Springs, AR 72543
Estimated Value: $324,339 - $409,000
--
Bed
2
Baths
2,016
Sq Ft
$185/Sq Ft
Est. Value
About This Home
This home is located at 808 Summer Trail Dr, Heber Springs, AR 72543 and is currently estimated at $373,835, approximately $185 per square foot. 808 Summer Trail Dr is a home located in Cleburne County with nearby schools including Heber Springs Elementary School, Heber Springs Middle School, and Heber Springs High School.
Ownership History
Date
Name
Owned For
Owner Type
Purchase Details
Closed on
Mar 4, 2015
Sold by
Ingram Gregory Neil and Ingram Leslie Jamison
Bought by
Cato Braden Allen and Cato Brittney Jo
Current Estimated Value
Home Financials for this Owner
Home Financials are based on the most recent Mortgage that was taken out on this home.
Original Mortgage
$194,000
Outstanding Balance
$148,475
Interest Rate
3.66%
Mortgage Type
Purchase Money Mortgage
Estimated Equity
$225,360
Purchase Details
Closed on
Apr 25, 2003
Bought by
Ingram Gregory N and Ingram Leslie J
Purchase Details
Closed on
Mar 13, 2003
Bought by
Lance Reynolds Construction, Inc
Purchase Details
Closed on
Oct 15, 2002
Bought by
Lance Reynolds Development, Inc
Purchase Details
Closed on
May 15, 2000
Bought by
Clebco Development, Inc
Purchase Details
Closed on
Feb 10, 2000
Bought by
Reylance, Inc
Create a Home Valuation Report for This Property
The Home Valuation Report is an in-depth analysis detailing your home's value as well as a comparison with similar homes in the area
Home Values in the Area
Average Home Value in this Area
Purchase History
| Date | Buyer | Sale Price | Title Company |
|---|---|---|---|
| Cato Braden Allen | -- | None Available | |
| Ingram Gregory N | $146,000 | -- | |
| Lance Reynolds Construction, Inc | -- | -- | |
| Lance Reynolds Development, Inc | -- | -- | |
| Clebco Development, Inc | -- | -- | |
| Clebco Development, Inc | $900,000 | -- | |
| Reylance, Inc | -- | -- |
Source: Public Records
Mortgage History
| Date | Status | Borrower | Loan Amount |
|---|---|---|---|
| Open | Cato Braden Allen | $194,000 |
Source: Public Records
Tax History Compared to Growth
Tax History
| Year | Tax Paid | Tax Assessment Tax Assessment Total Assessment is a certain percentage of the fair market value that is determined by local assessors to be the total taxable value of land and additions on the property. | Land | Improvement |
|---|---|---|---|---|
| 2024 | $1,943 | $45,182 | $3,000 | $42,182 |
| 2023 | $1,845 | $45,182 | $3,000 | $42,182 |
| 2022 | $1,692 | $45,182 | $3,000 | $42,182 |
| 2021 | $1,163 | $35,763 | $3,000 | $32,763 |
| 2020 | $1,163 | $35,763 | $3,000 | $32,763 |
| 2019 | $1,163 | $35,763 | $3,000 | $32,763 |
| 2018 | $1,181 | $35,763 | $3,000 | $32,763 |
| 2017 | $1,163 | $35,763 | $3,000 | $32,763 |
| 2016 | $1,214 | $36,971 | $4,600 | $32,371 |
| 2015 | $1,214 | $36,971 | $4,600 | $32,371 |
| 2014 | -- | $36,971 | $4,600 | $32,371 |
Source: Public Records
Map
Nearby Homes
- 1401 Roe's Ridge
- 1602 Roe's Ridge
- 404 Trailwood Dr
- 1412 Ridgefield Dr
- Lot 26 Scenic Place
- 209 Trailwood Dr
- 863 Copperfield Cove
- 2195 Achoma Dr
- 1835 Heber Springs Rd N
- 2255 Highway 25b
- 705 N Park St
- 307 Lo Hawk Dr
- 2421 Hwy 25b N
- 710 N Broadway St
- 429 E Moore St
- 508 Mustang Dr
- 502 E Clinton St
- 000 Arkansas 25 Bypass
- Lot 4 Thelma St
- 000 Wedding Ford Rd
- 808 Summer Trail
- 1502 Summer Heights Dr
- 1413 Summer Trail
- 1413 Summer Trail Dr
- 1509 Summer Heights
- 1410 Summer Heights Dr
- 1505 Summer Heights
- 1417 Summer Heights Dr
- 1409 Summer Trail Dr
- 1406 Summer Heights Dr
- 0 Summer Trail
- 1408 Summer Trail Dr
- 1408 Summer Trail
- 1415 Summer Heights Dr
- 1509 Summer Heights Dr
- 1411 Summer Heights Dr
- 802 Summer Heights Dr
- 806 Summer Heights Dr
- 720 Summer Heights Dr
- 901 Pineknot Ln