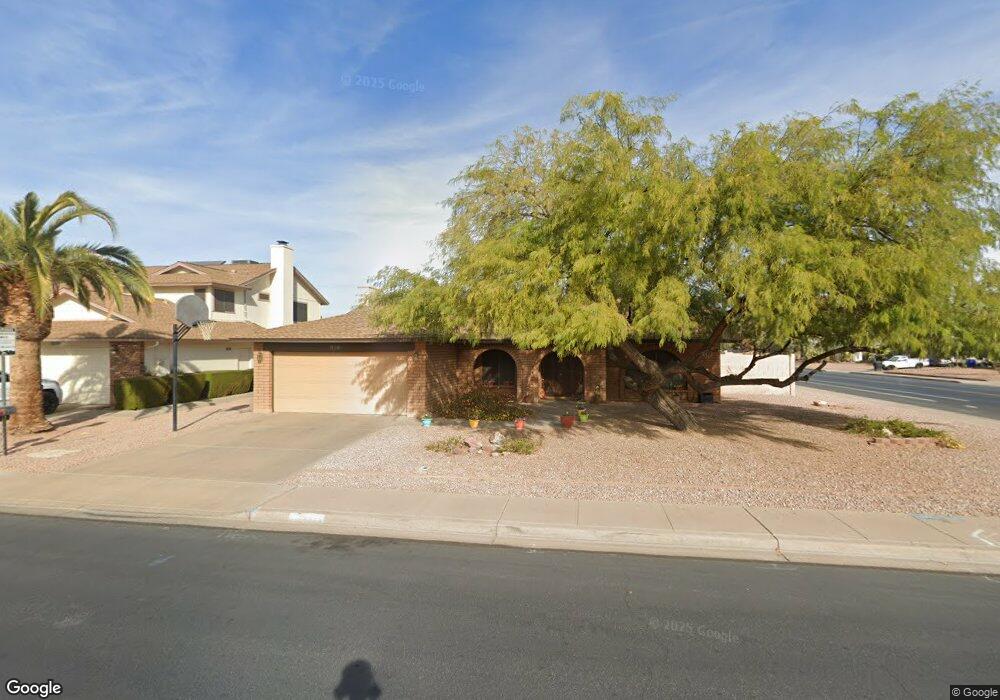
808 W Portobello Ave Mesa, AZ 85210
Dobson NeighborhoodEstimated Value: $385,575 - $480,000
--
Bed
2
Baths
1,649
Sq Ft
$274/Sq Ft
Est. Value
About This Home
This home is located at 808 W Portobello Ave, Mesa, AZ 85210 and is currently estimated at $451,144, approximately $273 per square foot. 808 W Portobello Ave is a home located in Maricopa County with nearby schools including Franklin at Brimhall Elementary School, Summit Academy Elementary, and Franklin Accelerated Academy Jordan Campus.
Ownership History
Date
Name
Owned For
Owner Type
Purchase Details
Closed on
Sep 27, 2023
Sold by
Covarrubias Anna Linda
Bought by
Anna L Covarrubias Revocable Trust and Covarrubias
Current Estimated Value
Purchase Details
Closed on
Jun 11, 1996
Sold by
Lunsford Charles T
Bought by
Covarrubias Gabriel Roy and Covarrubias Anna Linda
Home Financials for this Owner
Home Financials are based on the most recent Mortgage that was taken out on this home.
Original Mortgage
$78,320
Interest Rate
4.95%
Purchase Details
Closed on
Jun 7, 1996
Sold by
Covarrubias Gabriel Roy and Covarrubias Gilbert I
Bought by
Lunsford Charles T
Home Financials for this Owner
Home Financials are based on the most recent Mortgage that was taken out on this home.
Original Mortgage
$78,320
Interest Rate
4.95%
Create a Home Valuation Report for This Property
The Home Valuation Report is an in-depth analysis detailing your home's value as well as a comparison with similar homes in the area
Home Values in the Area
Average Home Value in this Area
Purchase History
| Date | Buyer | Sale Price | Title Company |
|---|---|---|---|
| Anna L Covarrubias Revocable Trust | -- | None Listed On Document | |
| Covarrubias Gabriel Roy | -- | Security Title Agency | |
| Lunsford Charles T | -- | Security Title Agency |
Source: Public Records
Mortgage History
| Date | Status | Borrower | Loan Amount |
|---|---|---|---|
| Previous Owner | Covarrubias Gabriel Roy | $78,320 |
Source: Public Records
Tax History Compared to Growth
Tax History
| Year | Tax Paid | Tax Assessment Tax Assessment Total Assessment is a certain percentage of the fair market value that is determined by local assessors to be the total taxable value of land and additions on the property. | Land | Improvement |
|---|---|---|---|---|
| 2025 | $1,533 | $18,456 | -- | -- |
| 2024 | $1,549 | $17,578 | -- | -- |
| 2023 | $1,549 | $33,520 | $6,700 | $26,820 |
| 2022 | $1,515 | $25,030 | $5,000 | $20,030 |
| 2021 | $1,557 | $23,360 | $4,670 | $18,690 |
| 2020 | $1,536 | $21,310 | $4,260 | $17,050 |
| 2019 | $1,423 | $19,710 | $3,940 | $15,770 |
| 2018 | $1,359 | $17,960 | $3,590 | $14,370 |
| 2017 | $1,316 | $16,720 | $3,340 | $13,380 |
| 2016 | $1,292 | $16,580 | $3,310 | $13,270 |
| 2015 | $1,220 | $15,650 | $3,130 | $12,520 |
Source: Public Records
Map
Nearby Homes
- 3011 S Extension Rd
- 945 W Portobello Ave
- 2834 S Extension Rd Unit 1031
- 716 W Boxelder Place
- 722 W Sterling Place
- 653 W Guadalupe Rd Unit 2005
- 653 W Guadalupe Rd Unit 2019
- 623 W Guadalupe Rd Unit 214
- 623 W Guadalupe Rd Unit 171
- 623 W Guadalupe Rd Unit 254
- 537 W Posada Ave
- 3139 S Date Cir
- 535 W Pantera Ave
- 508 W Pampa Ave
- 533 W Guadalupe Rd Unit 1122
- 533 W Guadalupe Rd Unit 2032
- 533 W Guadalupe Rd Unit 1001
- 3030 S Alma School Rd Unit 12
- 3030 S Alma School Rd Unit 10
- 3401 N Dakota St
- 816 W Portobello Ave
- 807 W Pecos Ave
- 815 W Pecos Ave
- 824 W Portobello Ave
- 809 W Portobello Ave
- 3043 S Extension Rd
- 817 W Portobello Ave
- 823 W Pecos Ave
- 3035 S Extension Rd
- 0 W Portobello Ave
- 832 W Portobello Ave Unit 2
- 825 W Portobello Ave Unit 2
- 763 W Portobello Ave
- 3027 S Extension Rd
- 831 W Pecos Ave
- 833 W Portobello Ave Unit 2
- 804 W Pampa Ave
- 812 W Pampa Ave
- 3019 S Extension Rd
- 806 W Pecos Ave