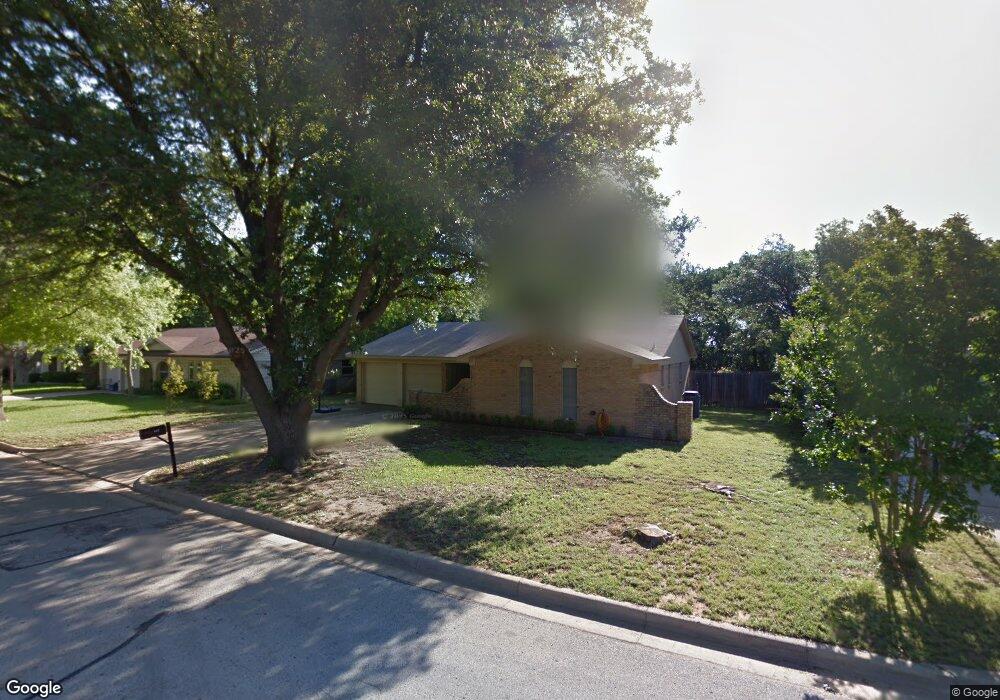
808 Warwick St Bedford, TX 76022
Estimated Value: $306,166 - $348,000
3
Beds
2
Baths
1,484
Sq Ft
$218/Sq Ft
Est. Value
About This Home
This home is located at 808 Warwick St, Bedford, TX 76022 and is currently estimated at $322,792, approximately $217 per square foot. 808 Warwick St is a home located in Tarrant County with nearby schools including Bell Manor Elementary School, Central J High School, and Trinity High School.
Ownership History
Date
Name
Owned For
Owner Type
Purchase Details
Closed on
Jan 27, 2023
Sold by
Abdalla Ayad
Bought by
Abdalla Ayad and Hanna Amal I
Current Estimated Value
Home Financials for this Owner
Home Financials are based on the most recent Mortgage that was taken out on this home.
Original Mortgage
$138,000
Outstanding Balance
$121,573
Interest Rate
5.52%
Mortgage Type
New Conventional
Estimated Equity
$201,219
Purchase Details
Closed on
Jan 9, 2023
Sold by
Myers The Home Buyers Of Dallas Llc
Bought by
Abdalla Ayad
Home Financials for this Owner
Home Financials are based on the most recent Mortgage that was taken out on this home.
Original Mortgage
$138,000
Outstanding Balance
$121,573
Interest Rate
5.52%
Mortgage Type
New Conventional
Estimated Equity
$201,219
Create a Home Valuation Report for This Property
The Home Valuation Report is an in-depth analysis detailing your home's value as well as a comparison with similar homes in the area
Home Values in the Area
Average Home Value in this Area
Purchase History
| Date | Buyer | Sale Price | Title Company |
|---|---|---|---|
| Abdalla Ayad | -- | Fidelity National Title | |
| Abdalla Ayad | -- | Fidelity National Title | |
| Myers The Home Buyers Of Dallas Llc | -- | Fidelity National Title |
Source: Public Records
Mortgage History
| Date | Status | Borrower | Loan Amount |
|---|---|---|---|
| Open | Abdalla Ayad | $138,000 | |
| Previous Owner | Abdalla Ayad | $138,000 |
Source: Public Records
Tax History Compared to Growth
Tax History
| Year | Tax Paid | Tax Assessment Tax Assessment Total Assessment is a certain percentage of the fair market value that is determined by local assessors to be the total taxable value of land and additions on the property. | Land | Improvement |
|---|---|---|---|---|
| 2025 | $4,126 | $211,911 | $65,000 | $146,911 |
| 2024 | $4,126 | $211,911 | $65,000 | $146,911 |
| 2023 | $3,608 | $223,013 | $45,000 | $178,013 |
| 2022 | $3,735 | $171,029 | $45,000 | $126,029 |
| 2021 | $3,766 | $159,893 | $45,000 | $114,893 |
| 2020 | $4,310 | $181,260 | $45,000 | $136,260 |
| 2019 | $4,152 | $182,488 | $45,000 | $137,488 |
| 2018 | $1,522 | $155,373 | $25,000 | $130,373 |
| 2017 | $3,513 | $145,212 | $25,000 | $120,212 |
| 2016 | $3,347 | $138,359 | $25,000 | $113,359 |
| 2015 | $1,568 | $133,887 | $24,000 | $109,887 |
| 2014 | $1,568 | $114,600 | $18,000 | $96,600 |
Source: Public Records
Map
Nearby Homes
- 800 Prestwick St
- 808 Gregory Ave
- 828 Gregory Ave
- 2620 Britany Cir
- 2420 Dalewood Ln
- 1216 Princeton Place
- 1049 Stableway Ln
- 2101 Gettysburg Place
- 2428 Chestnut Way
- 2024 Charleston Dr
- 2504 Westpark Way Cir
- 2303 Mcmullin Dr
- 1116 Highpoint Rd
- 804 Natchez Ave
- 1213 Greendale Dr
- 952 Charleston Dr
- 2421 Creek Villas Dr
- 2201 Greendale Ct
- 2150 Eva Ln
- 2025 Schumac Ln
- 812 Warwick St
- 804 Warwick St
- 816 Warwick St
- 2300 Windsor Ct
- 800 Warwick St
- 2518 Sakeena Ct
- 2513 Pipeline Rd
- 2516 Sakeena Ct
- 2301 Windsor Ct
- 813 Warwick St
- 2524 Sakeena Ct
- 2304 Windsor Ct
- 2305 Windsor Ct
- 817 Warwick St
- 2522 Sakeena Ct
- 2510 Sakeena Ct
- 2530 Sakeena Ct
- 900 Warwick St
- 2308 Windsor Ct
- 2305 Warwick Ct