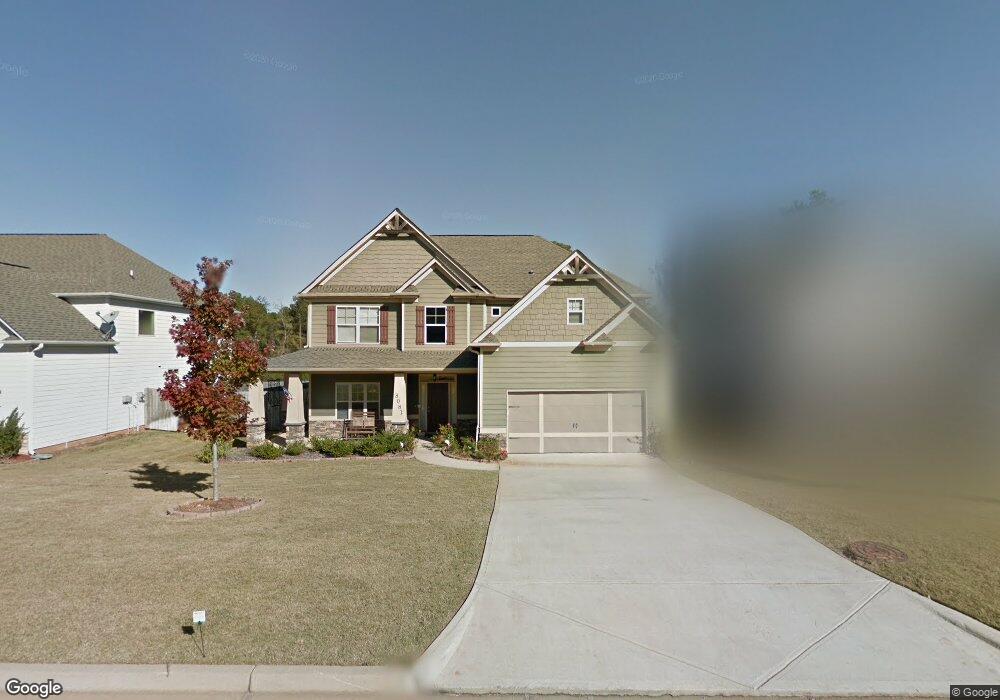
8081 Gilliam Ct Columbus, GA 31904
Northern Columbus NeighborhoodEstimated Value: $375,000 - $392,000
4
Beds
4
Baths
2,770
Sq Ft
$138/Sq Ft
Est. Value
About This Home
This home is located at 8081 Gilliam Ct, Columbus, GA 31904 and is currently estimated at $381,547, approximately $137 per square foot. 8081 Gilliam Ct is a home located in Muscogee County with nearby schools including Double Churches Elementary School, Double Churches Middle School, and Northside High School.
Ownership History
Date
Name
Owned For
Owner Type
Purchase Details
Closed on
Jul 12, 2010
Sold by
Loduca Paul A
Bought by
Loduca Paul A and Loduca Summer D
Current Estimated Value
Home Financials for this Owner
Home Financials are based on the most recent Mortgage that was taken out on this home.
Original Mortgage
$268,476
Outstanding Balance
$178,851
Interest Rate
4.77%
Mortgage Type
VA
Estimated Equity
$202,696
Purchase Details
Closed on
Jul 8, 2010
Sold by
Jenkins Brandon H and Jenkins Amy P
Bought by
Loduca Paul A
Home Financials for this Owner
Home Financials are based on the most recent Mortgage that was taken out on this home.
Original Mortgage
$268,476
Outstanding Balance
$178,851
Interest Rate
4.77%
Mortgage Type
VA
Estimated Equity
$202,696
Purchase Details
Closed on
Apr 9, 2008
Sold by
Jeff Lindsey Communities Inc
Bought by
Jenkins Brandon H and Jenkins Amy P
Home Financials for this Owner
Home Financials are based on the most recent Mortgage that was taken out on this home.
Original Mortgage
$35,997
Interest Rate
5.51%
Mortgage Type
Credit Line Revolving
Create a Home Valuation Report for This Property
The Home Valuation Report is an in-depth analysis detailing your home's value as well as a comparison with similar homes in the area
Home Values in the Area
Average Home Value in this Area
Purchase History
| Date | Buyer | Sale Price | Title Company |
|---|---|---|---|
| Loduca Paul A | -- | None Available | |
| Loduca Paul A | $259,900 | None Available | |
| Jenkins Brandon H | $240,000 | None Available |
Source: Public Records
Mortgage History
| Date | Status | Borrower | Loan Amount |
|---|---|---|---|
| Open | Loduca Paul A | $268,476 | |
| Previous Owner | Jenkins Brandon H | $35,997 | |
| Previous Owner | Jenkins Brandon H | $191,984 |
Source: Public Records
Tax History Compared to Growth
Tax History
| Year | Tax Paid | Tax Assessment Tax Assessment Total Assessment is a certain percentage of the fair market value that is determined by local assessors to be the total taxable value of land and additions on the property. | Land | Improvement |
|---|---|---|---|---|
| 2025 | $4,642 | $118,584 | $22,008 | $96,576 |
| 2024 | $4,642 | $118,584 | $22,008 | $96,576 |
| 2023 | $4,671 | $118,584 | $22,008 | $96,576 |
| 2022 | $3,800 | $93,064 | $16,504 | $76,560 |
| 2021 | $3,606 | $88,312 | $16,504 | $71,808 |
| 2020 | $3,607 | $88,312 | $16,504 | $71,808 |
| 2019 | $3,618 | $88,312 | $16,504 | $71,808 |
| 2018 | $3,618 | $88,312 | $16,504 | $71,808 |
| 2017 | $3,630 | $88,312 | $16,504 | $71,808 |
| 2016 | $4,340 | $105,200 | $18,800 | $86,400 |
| 2015 | $3,797 | $105,200 | $18,800 | $86,400 |
| 2014 | $3,802 | $105,200 | $18,800 | $86,400 |
| 2013 | -- | $105,200 | $18,800 | $86,400 |
Source: Public Records
Map
Nearby Homes
- 1058 Cedarbrook Dr
- 7841 Edgewater Dr
- 7701 Gray Shoals Dr
- 1579 Magnolia Way
- 7635 Edgewater Dr
- 8344 Twin Chapel Dr
- 8259 Lantern Ln
- 1535 Doubletree Dr
- 928 Heiferhorn Trace
- 1727 Fountain Ct
- 907 Double Churches Rd
- 1438 Grove Park Dr Unit 13B
- 7995 Big Creek Place
- 1049 Red Maple Way
- 1255 Woodville Ct
- 7348 Cedar Creek Loop
- 517 Double Churches Rd
- 1719 Double Churches Rd
- 281 Zachary Ct
- 1355 Cloverdale Rd
- 8075 Gilliam Ct
- 8087 Gilliam Ct
- 8093 Gilliam Ct Unit D
- 0 Gilliam Ct
- 8069 Gilliam Ct
- 8088 Gilliam Ct
- 8082 Gilliam Ct
- 8076 Gilliam Ct
- 8070 Gilliam Ct
- 8099 Gilliam Ct
- 7964 Nature Trail
- 7970 Nature Trail
- 8094 Gilliam Ct
- 8100 Gilliam Ct
- 7976 Nature Trail
- 7958 Nature Trail
- 1335 Maplebrook Dr
- 7952 Nature Trail
- 1339 Maplebrook Dr
- 7982 Nature Trail