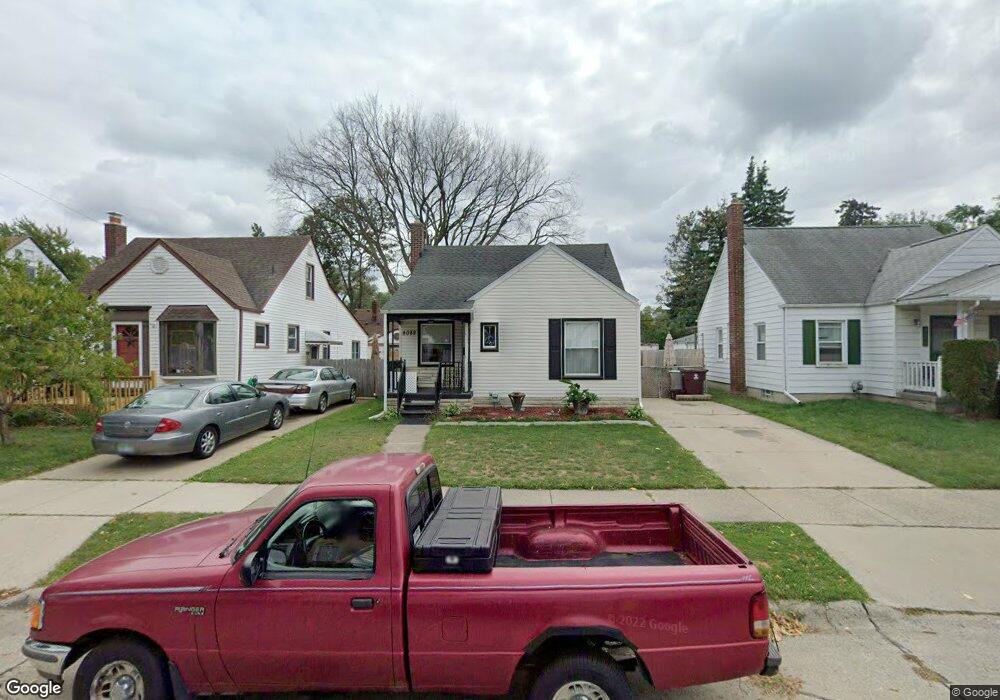
8082 Sterling Center Line, MI 48015
Estimated Value: $159,866 - $177,000
3
Beds
2
Baths
908
Sq Ft
$183/Sq Ft
Est. Value
About This Home
This home is located at 8082 Sterling, Center Line, MI 48015 and is currently estimated at $166,467, approximately $183 per square foot. 8082 Sterling is a home located in Macomb County with nearby schools including May V. Peck Elementary School, Center Line High School, and Wolfe Middle School.
Ownership History
Date
Name
Owned For
Owner Type
Purchase Details
Closed on
Sep 28, 2021
Sold by
Newby Haley Rae
Bought by
Weiner Dawn M
Current Estimated Value
Purchase Details
Closed on
Jun 30, 2020
Sold by
Pasquantonio Gina
Bought by
Newby Haley Rae
Purchase Details
Closed on
Oct 8, 2015
Sold by
Pasquantonio Gina
Bought by
Pasquantonio Gina and Smith Candace Marie
Purchase Details
Closed on
Jan 4, 2011
Sold by
Citimortgage Inc
Bought by
Federal National Mortgage Association
Purchase Details
Closed on
Oct 8, 2010
Sold by
Palmer Monika
Bought by
Citimortgage Inc
Create a Home Valuation Report for This Property
The Home Valuation Report is an in-depth analysis detailing your home's value as well as a comparison with similar homes in the area
Home Values in the Area
Average Home Value in this Area
Purchase History
| Date | Buyer | Sale Price | Title Company |
|---|---|---|---|
| Weiner Dawn M | $142,000 | First American Title | |
| Newby Haley Rae | $118,000 | Visionary Title Agency Llc | |
| Pasquantonio Gina | -- | Attorney | |
| Federal National Mortgage Association | -- | None Available | |
| Citimortgage Inc | $12,800 | None Available |
Source: Public Records
Tax History Compared to Growth
Tax History
| Year | Tax Paid | Tax Assessment Tax Assessment Total Assessment is a certain percentage of the fair market value that is determined by local assessors to be the total taxable value of land and additions on the property. | Land | Improvement |
|---|---|---|---|---|
| 2025 | $3,299 | $66,300 | $0 | $0 |
| 2024 | $2,605 | $62,500 | $0 | $0 |
| 2023 | $2,513 | $54,900 | $0 | $0 |
| 2022 | $2,986 | $44,400 | $0 | $0 |
| 2021 | $2,957 | $40,900 | $0 | $0 |
| 2020 | $1,278 | $36,000 | $0 | $0 |
| 2019 | $1,634 | $29,200 | $0 | $0 |
| 2018 | $1,629 | $25,270 | $0 | $0 |
| 2017 | $1,499 | $21,290 | $4,330 | $16,960 |
| 2016 | $1,350 | $21,290 | $0 | $0 |
| 2015 | -- | $19,660 | $0 | $0 |
| 2011 | -- | $25,500 | $3,400 | $22,100 |
Source: Public Records
Map
Nearby Homes