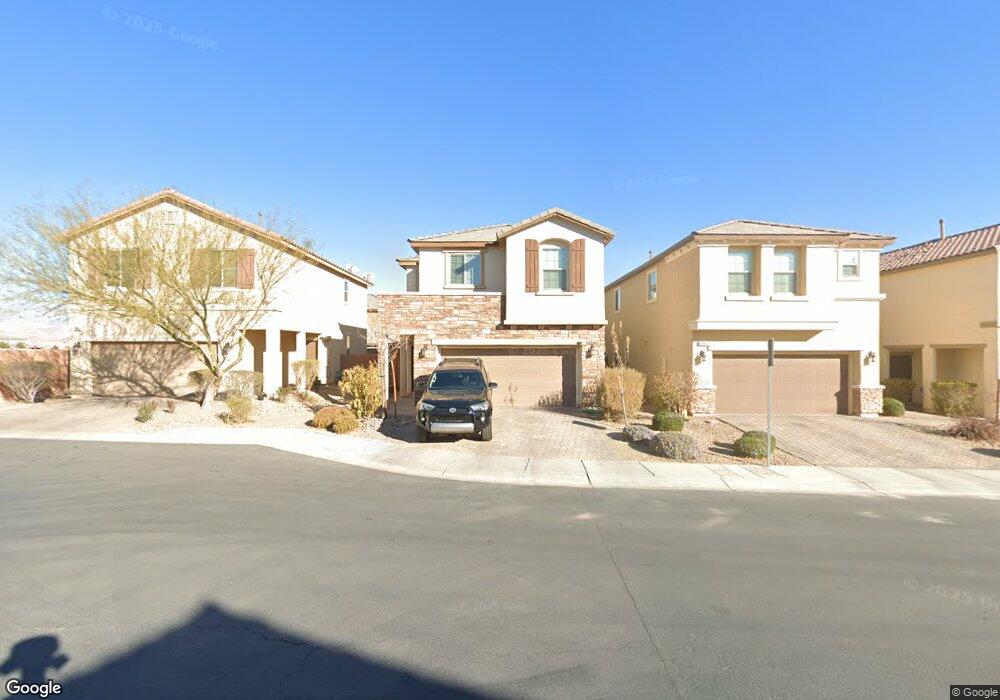
8086 Spencer Butte Ct Unit none Las Vegas, NV 89113
Coronado Ranch NeighborhoodEstimated Value: $447,000 - $535,000
3
Beds
3
Baths
1,858
Sq Ft
$259/Sq Ft
Est. Value
About This Home
This home is located at 8086 Spencer Butte Ct Unit none, Las Vegas, NV 89113 and is currently estimated at $480,885, approximately $258 per square foot. 8086 Spencer Butte Ct Unit none is a home located in Clark County with nearby schools including Judith D Steele Elementary School, Lawrence & Heidi Canarelli Middle School, and Sierra Vista High School.
Ownership History
Date
Name
Owned For
Owner Type
Purchase Details
Closed on
Dec 28, 2021
Sold by
Chyau Beyde and Chyau Liaung Jack
Bought by
Bautista Lolinda R and Bautista Larry B
Current Estimated Value
Home Financials for this Owner
Home Financials are based on the most recent Mortgage that was taken out on this home.
Original Mortgage
$416,100
Outstanding Balance
$381,968
Interest Rate
3.12%
Mortgage Type
New Conventional
Estimated Equity
$98,917
Purchase Details
Closed on
Dec 18, 2014
Sold by
Richmond American Homes Of Nevada Inc
Bought by
Chyau Beyde and Chyau Liaung Jang
Purchase Details
Closed on
Sep 10, 2010
Sold by
Garcia Juan M and Garcia Maria R
Bought by
Federal National Mortgage Association
Create a Home Valuation Report for This Property
The Home Valuation Report is an in-depth analysis detailing your home's value as well as a comparison with similar homes in the area
Home Values in the Area
Average Home Value in this Area
Purchase History
| Date | Buyer | Sale Price | Title Company |
|---|---|---|---|
| Bautista Lolinda R | $440,000 | Chicago Title Las Vegas | |
| Chyau Beyde | $249,587 | Ticor Title Las Vegas | |
| Federal National Mortgage Association | $329,863 | Accommodation |
Source: Public Records
Mortgage History
| Date | Status | Borrower | Loan Amount |
|---|---|---|---|
| Open | Bautista Lolinda R | $416,100 |
Source: Public Records
Tax History Compared to Growth
Tax History
| Year | Tax Paid | Tax Assessment Tax Assessment Total Assessment is a certain percentage of the fair market value that is determined by local assessors to be the total taxable value of land and additions on the property. | Land | Improvement |
|---|---|---|---|---|
| 2025 | $3,250 | $135,272 | $38,500 | $96,772 |
| 2024 | $3,156 | $135,272 | $38,500 | $96,772 |
| 2023 | $2,310 | $125,201 | $35,000 | $90,201 |
| 2022 | $3,212 | $110,269 | $28,000 | $82,269 |
| 2021 | $2,975 | $103,948 | $26,250 | $77,698 |
| 2020 | $2,759 | $101,901 | $25,200 | $76,701 |
| 2019 | $2,586 | $96,154 | $21,000 | $75,154 |
| 2018 | $2,468 | $91,023 | $19,250 | $71,773 |
| 2017 | $2,500 | $85,243 | $18,550 | $66,693 |
| 2016 | $2,310 | $82,065 | $14,000 | $68,065 |
| 2015 | $2,304 | $10,150 | $10,150 | $0 |
Source: Public Records
Map
Nearby Homes
- 8142 Rockflower St
- 8133 Bearpoppy Ct
- Tanglewood Plan at Maxwell Ridge
- Frasera Plan at Maxwell Ridge
- Covena Plan at Maxwell Ridge
- 8171 Misty Horizon Ct
- 7895 Bethel Heights Ln
- 8057 Adelaide Hills St
- 7866 Pink Opal Ave
- 7867 Pink Opal Ave
- 7842 Pink Opal Ave
- 8003 Adelaide Hills St
- 8411 S Cimarron Rd
- 8310 W Camero Ave
- 8278 Palladium St
- 8284 Palladium St
- 7983 Texas Hills St
- 8144 Monsoon Bay St
- 7977 Texas Hills St
- 8241 Lantana Springs St
- 8086 Spencer Butte Ct
- 8080 Spencer Butte Ct
- 8092 Spencer Butte Ct
- 8074 Spencer Butte Ct
- 8085 Chocolate Hills Ct
- 8091 Chocolate Hills Ct
- 8079 Chocolate Hills Ct
- 8068 Spencer Butte Ct
- 8073 Chocolate Hills Ct
- 8087 Spencer Butte Ct
- 8136 Rockflower St
- 8081 Spencer Butte Ct
- 8067 Chocolate Hills Ct
- 8093 Spencer Butte Ct
- 8075 Spencer Butte Ct Unit none
- 8075 Spencer Butte Ct
- 8172 Rockflower St
- 8069 Spencer Butte Ct
- 8124 Rockflower St
- 8148 Castle Dome St