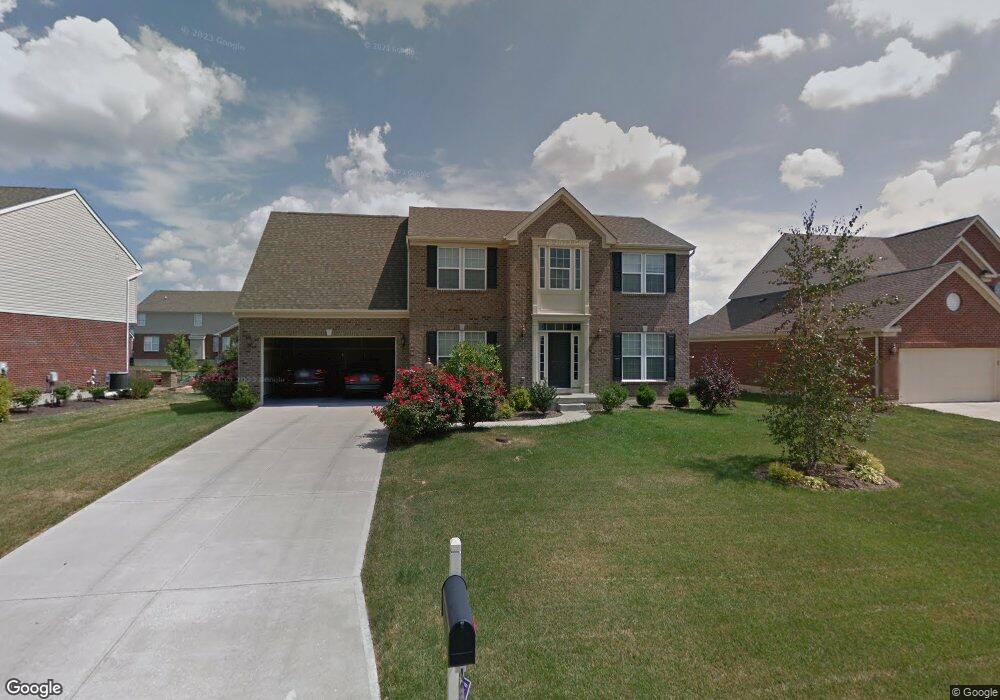
8088 Vegas Ct West Chester, OH 45069
West Chester Township NeighborhoodEstimated Value: $445,000 - $522,000
4
Beds
3
Baths
3,202
Sq Ft
$154/Sq Ft
Est. Value
About This Home
This home is located at 8088 Vegas Ct, West Chester, OH 45069 and is currently estimated at $494,017, approximately $154 per square foot. 8088 Vegas Ct is a home located in Butler County with nearby schools including Endeavor Elementary School, Lakota Plains Junior School, and Lakota West High School.
Ownership History
Date
Name
Owned For
Owner Type
Purchase Details
Closed on
Oct 12, 2018
Sold by
Kali Kasarapu Srinivas and Kali Deepthi
Bought by
Singh Paramijit and Kaur Nirmaljit
Current Estimated Value
Home Financials for this Owner
Home Financials are based on the most recent Mortgage that was taken out on this home.
Original Mortgage
$240,000
Outstanding Balance
$209,740
Interest Rate
4.6%
Mortgage Type
New Conventional
Estimated Equity
$284,277
Purchase Details
Closed on
Nov 19, 2009
Sold by
Nvr Inc
Bought by
Kasarapu Srinivas and Deepthi Kali
Home Financials for this Owner
Home Financials are based on the most recent Mortgage that was taken out on this home.
Original Mortgage
$221,719
Interest Rate
4.95%
Mortgage Type
FHA
Purchase Details
Closed on
Sep 8, 2009
Sold by
Nvr Ohio Acquisition Llc
Bought by
Nvr Inc
Purchase Details
Closed on
Mar 1, 2005
Sold by
Wcv Llc
Bought by
Beazer Homes Investments Llc
Create a Home Valuation Report for This Property
The Home Valuation Report is an in-depth analysis detailing your home's value as well as a comparison with similar homes in the area
Home Values in the Area
Average Home Value in this Area
Purchase History
| Date | Buyer | Sale Price | Title Company |
|---|---|---|---|
| Singh Paramijit | $300,000 | Reliable Land Title Agency L | |
| Kasarapu Srinivas | $229,375 | None Available | |
| Nvr Inc | -- | Attorney | |
| Beazer Homes Investments Llc | $524,000 | -- |
Source: Public Records
Mortgage History
| Date | Status | Borrower | Loan Amount |
|---|---|---|---|
| Open | Singh Paramijit | $240,000 | |
| Previous Owner | Kasarapu Srinivas | $221,719 |
Source: Public Records
Tax History Compared to Growth
Tax History
| Year | Tax Paid | Tax Assessment Tax Assessment Total Assessment is a certain percentage of the fair market value that is determined by local assessors to be the total taxable value of land and additions on the property. | Land | Improvement |
|---|---|---|---|---|
| 2024 | $5,534 | $133,480 | $17,680 | $115,800 |
| 2023 | $5,495 | $140,310 | $17,680 | $122,630 |
| 2022 | $5,309 | $94,840 | $17,680 | $77,160 |
| 2021 | $4,831 | $91,170 | $17,680 | $73,490 |
| 2020 | $4,945 | $91,170 | $17,680 | $73,490 |
| 2019 | $8,286 | $86,470 | $19,270 | $67,200 |
| 2018 | $4,918 | $86,470 | $19,270 | $67,200 |
| 2017 | $5,004 | $86,470 | $19,270 | $67,200 |
| 2016 | $5,192 | $84,520 | $19,270 | $65,250 |
| 2015 | $5,167 | $84,520 | $19,270 | $65,250 |
| 2014 | $4,790 | $84,520 | $19,270 | $65,250 |
| 2013 | $4,790 | $75,490 | $19,270 | $56,220 |
Source: Public Records
Map
Nearby Homes
- 8105 Vegas Cir
- 8024 Seabury Ct
- 8021 Pinnacle Point Dr
- 8021 Pinnacle Point Dr Unit 102
- 8003 Pinnacle Point Dr
- 7990 Pinnacle Point Dr
- 7908 Pinnacle Point Dr
- 8265 Windy Harbor Way
- 8273 Windy Harbor Way
- 4212 R E Smith Dr
- 8194 Westfall Ln
- 7795 Rock Port Way
- 4532 Tylers Vista
- 8422 Misty Shore Dr
- 4387 Tylers Estates Dr
- 7611 Tylers Hill Ct
- 7695 Fox Chase Dr
- 7956 Bobtail Ct
- 4210 Tylers Estates Dr
- 8354 Park Place