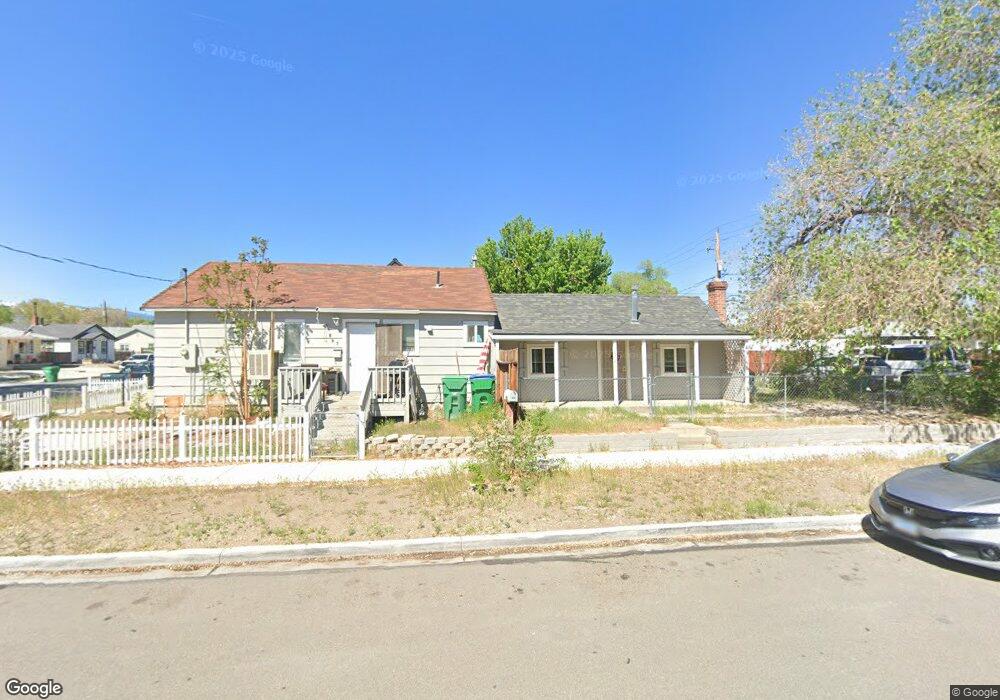
809 16th St Sparks, NV 89431
Downtown Sparks NeighborhoodEstimated Value: $361,451 - $517,000
5
Beds
2
Baths
1,585
Sq Ft
$293/Sq Ft
Est. Value
About This Home
This home is located at 809 16th St, Sparks, NV 89431 and is currently estimated at $464,363, approximately $292 per square foot. 809 16th St is a home located in Washoe County with nearby schools including Robert Mitchell Elementary School, Sparks Middle School, and Sparks High School.
Ownership History
Date
Name
Owned For
Owner Type
Purchase Details
Closed on
Oct 6, 2021
Sold by
Marroquin Jorge
Bought by
Delaney Pablo A and Delaney Ruth E
Current Estimated Value
Home Financials for this Owner
Home Financials are based on the most recent Mortgage that was taken out on this home.
Original Mortgage
$315,000
Outstanding Balance
$287,251
Interest Rate
2.8%
Mortgage Type
New Conventional
Estimated Equity
$177,112
Purchase Details
Closed on
Oct 16, 2017
Sold by
Mixie Gerald F and Mixie Valerie F
Bought by
Marroquin Jorge
Home Financials for this Owner
Home Financials are based on the most recent Mortgage that was taken out on this home.
Original Mortgage
$255,290
Interest Rate
3.82%
Mortgage Type
FHA
Purchase Details
Closed on
Jul 9, 2008
Sold by
Miller Mixie Gerald F and Miller Mixie Valerie
Bought by
Mixie Gerald F and Mixie Valerie F
Create a Home Valuation Report for This Property
The Home Valuation Report is an in-depth analysis detailing your home's value as well as a comparison with similar homes in the area
Home Values in the Area
Average Home Value in this Area
Purchase History
| Date | Buyer | Sale Price | Title Company |
|---|---|---|---|
| Delaney Pablo A | $420,000 | First Centennial Reno | |
| Marroquin Jorge | $264,500 | First Centennial Reno | |
| Mixie Gerald F | -- | None Available |
Source: Public Records
Mortgage History
| Date | Status | Borrower | Loan Amount |
|---|---|---|---|
| Open | Delaney Pablo A | $315,000 | |
| Previous Owner | Marroquin Jorge | $255,290 |
Source: Public Records
Tax History Compared to Growth
Tax History
| Year | Tax Paid | Tax Assessment Tax Assessment Total Assessment is a certain percentage of the fair market value that is determined by local assessors to be the total taxable value of land and additions on the property. | Land | Improvement |
|---|---|---|---|---|
| 2025 | $848 | $59,153 | $41,720 | $17,433 |
| 2024 | $848 | $56,210 | $38,710 | $17,500 |
| 2023 | $824 | $54,353 | $39,305 | $15,048 |
| 2022 | $802 | $45,625 | $32,865 | $12,760 |
| 2021 | $2,334 | $37,886 | $25,375 | $12,511 |
| 2020 | $1,937 | $38,597 | $26,250 | $12,347 |
| 2019 | $695 | $34,202 | $22,470 | $11,732 |
| 2018 | $672 | $26,446 | $15,190 | $11,256 |
| 2017 | $639 | $24,954 | $14,000 | $10,954 |
| 2016 | $622 | $22,110 | $11,200 | $10,910 |
| 2015 | $623 | $18,990 | $8,050 | $10,940 |
| 2014 | $601 | $17,175 | $7,000 | $10,175 |
| 2013 | -- | $16,016 | $6,160 | $9,856 |
Source: Public Records
Map
Nearby Homes