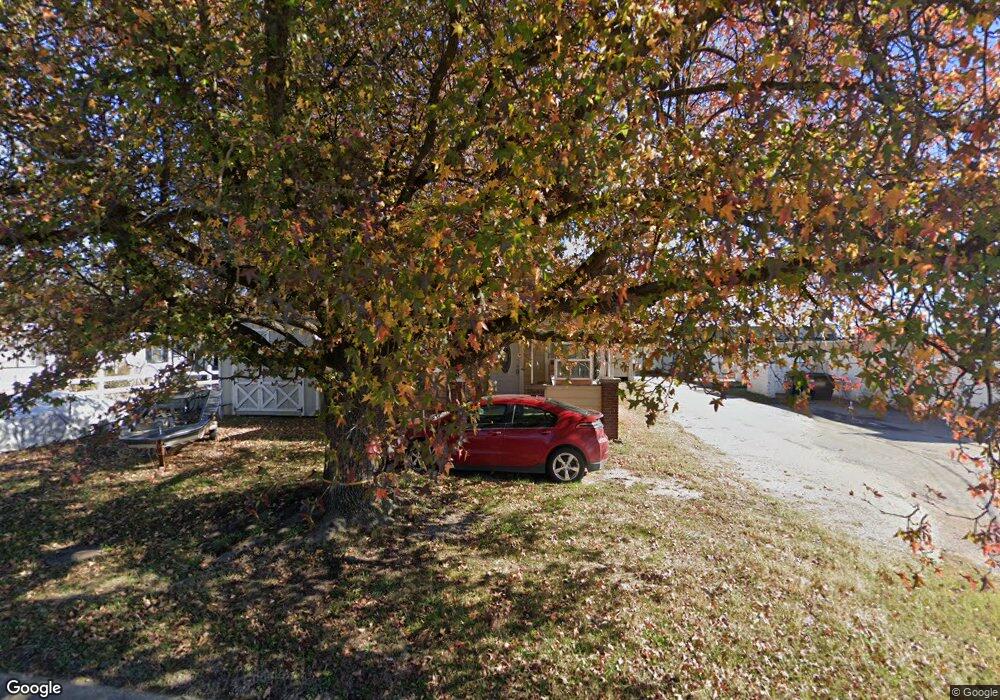
809 9th St Monett, MO 65708
Estimated Value: $95,000 - $131,316
2
Beds
1
Bath
936
Sq Ft
$129/Sq Ft
Est. Value
About This Home
This home is located at 809 9th St, Monett, MO 65708 and is currently estimated at $120,579, approximately $128 per square foot. 809 9th St is a home located in Lawrence County with nearby schools including Monett Elementary School, Monett Intermediate School, and Central Park Elementary School.
Ownership History
Date
Name
Owned For
Owner Type
Purchase Details
Closed on
Dec 22, 2023
Sold by
Hensley Miya
Bought by
Hensley John D
Current Estimated Value
Purchase Details
Closed on
Jan 6, 2022
Sold by
Marquez Llc
Bought by
Hensley John D and Hensley Miya
Home Financials for this Owner
Home Financials are based on the most recent Mortgage that was taken out on this home.
Original Mortgage
$26,987
Interest Rate
2.33%
Purchase Details
Closed on
Dec 28, 2021
Sold by
Marquez Antonio and Marquez Yolanda
Bought by
Hensley John D and Hensley Miya
Home Financials for this Owner
Home Financials are based on the most recent Mortgage that was taken out on this home.
Original Mortgage
$26,987
Interest Rate
2.33%
Purchase Details
Closed on
Sep 10, 2009
Sold by
Scott Kelly A
Bought by
Rangel Manuel H and Rangel Maria O
Create a Home Valuation Report for This Property
The Home Valuation Report is an in-depth analysis detailing your home's value as well as a comparison with similar homes in the area
Home Values in the Area
Average Home Value in this Area
Purchase History
| Date | Buyer | Sale Price | Title Company |
|---|---|---|---|
| Hensley John D | -- | None Listed On Document | |
| Hensley John D | -- | None Listed On Document | |
| Hensley John D | -- | None Listed On Document | |
| Hensley John D | -- | None Available | |
| Rangel Manuel H | -- | -- | |
| Rangel Manuel H | -- | None Available |
Source: Public Records
Mortgage History
| Date | Status | Borrower | Loan Amount |
|---|---|---|---|
| Previous Owner | Hensley John D | $26,987 | |
| Previous Owner | Hensley John D | $68,272 |
Source: Public Records
Tax History
| Year | Tax Paid | Tax Assessment Tax Assessment Total Assessment is a certain percentage of the fair market value that is determined by local assessors to be the total taxable value of land and additions on the property. | Land | Improvement |
|---|---|---|---|---|
| 2025 | $394 | $8,110 | $1,460 | $6,650 |
| 2024 | $364 | $7,460 | $1,460 | $6,000 |
| 2023 | $343 | $7,460 | $1,460 | $6,000 |
| 2022 | $341 | $7,030 | $1,460 | $5,570 |
| 2021 | $341 | $7,030 | $1,460 | $5,570 |
| 2020 | $321 | $6,560 | $990 | $5,570 |
| 2019 | $306 | $6,560 | $990 | $5,570 |
| 2018 | $291 | $6,560 | $990 | $5,570 |
| 2017 | $289 | $6,560 | $990 | $5,570 |
| 2016 | -- | $6,010 | $990 | $5,020 |
| 2015 | -- | $6,010 | $990 | $5,020 |
| 2014 | -- | $6,010 | $990 | $5,020 |
Source: Public Records
Map
Nearby Homes
Your Personal Tour Guide
Ask me questions while you tour the home.