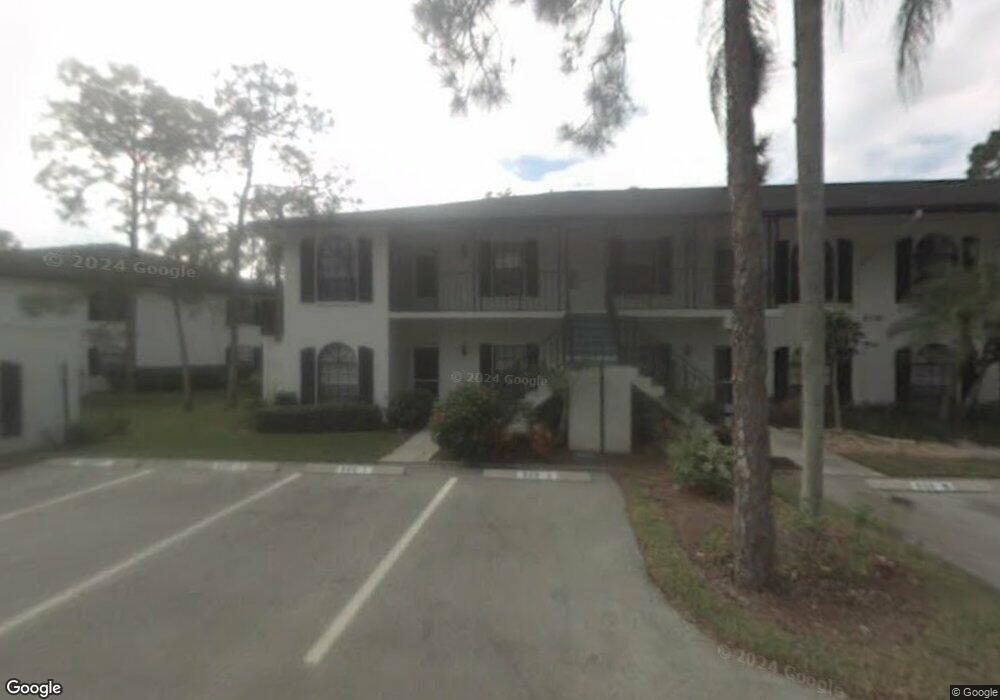
809 Augusta Blvd Unit 1 Naples, FL 34113
Lely Country Club NeighborhoodEstimated Value: $266,000 - $314,000
Studio
--
Bath
1,375
Sq Ft
$210/Sq Ft
Est. Value
About This Home
This home is located at 809 Augusta Blvd Unit 1, Naples, FL 34113 and is currently estimated at $289,011, approximately $210 per square foot. 809 Augusta Blvd Unit 1 is a home located in Collier County with nearby schools including Lely Elementary School, Manatee Middle School, and Lely High School.
Ownership History
Date
Name
Owned For
Owner Type
Purchase Details
Closed on
Feb 5, 2021
Sold by
Mahoney Joseph E and Mahoney Charles H
Bought by
Mahoney Joseph E and Eaglewood Land Trust
Current Estimated Value
Purchase Details
Closed on
Jul 26, 2016
Sold by
Gale P Cummings
Bought by
Jones Randi and Jones Richard
Home Financials for this Owner
Home Financials are based on the most recent Mortgage that was taken out on this home.
Original Mortgage
$122,550
Interest Rate
3.45%
Purchase Details
Closed on
May 13, 2014
Sold by
Mahoney Joseph E and Mahoney Charles H
Bought by
Mahoney Joseph E and Mahoney Charles H
Purchase Details
Closed on
Aug 9, 2012
Sold by
Forrester Paula C
Bought by
Mahoney Joseph E and Mahoney Charles H
Purchase Details
Closed on
Dec 13, 1999
Sold by
Dwyer William G and Dwyer Marion L
Bought by
Dwyer Carolyn T
Home Financials for this Owner
Home Financials are based on the most recent Mortgage that was taken out on this home.
Original Mortgage
$60,000
Interest Rate
7.67%
Create a Home Valuation Report for This Property
The Home Valuation Report is an in-depth analysis detailing your home's value as well as a comparison with similar homes in the area
Home Values in the Area
Average Home Value in this Area
Purchase History
| Date | Buyer | Sale Price | Title Company |
|---|---|---|---|
| Mahoney Joseph E | $90,000 | None Available | |
| Jones Randi | -- | -- | |
| Mahoney Joseph E | -- | Attorney | |
| Mahoney Joseph E | $125,000 | Attorney | |
| Dwyer Carolyn T | $86,100 | -- |
Source: Public Records
Mortgage History
| Date | Status | Borrower | Loan Amount |
|---|---|---|---|
| Previous Owner | Jones Randi | $122,550 | |
| Previous Owner | Jones Randi | -- | |
| Previous Owner | Dwyer Carolyn T | $60,000 |
Source: Public Records
Tax History
| Year | Tax Paid | Tax Assessment Tax Assessment Total Assessment is a certain percentage of the fair market value that is determined by local assessors to be the total taxable value of land and additions on the property. | Land | Improvement |
|---|---|---|---|---|
| 2025 | $2,669 | $262,375 | -- | $262,375 |
| 2024 | $2,922 | $262,375 | -- | $262,375 |
| 2023 | $2,922 | $254,736 | $0 | $0 |
| 2022 | $2,566 | $231,578 | $0 | $231,578 |
| 2021 | $1,939 | $167,875 | $0 | $167,875 |
| 2020 | $1,875 | $163,750 | $0 | $163,750 |
| 2019 | $1,746 | $151,375 | $0 | $151,375 |
| 2018 | $1,893 | $158,208 | $0 | $0 |
| 2017 | $1,760 | $143,825 | $0 | $0 |
| 2016 | $1,527 | $130,750 | $0 | $0 |
| 2015 | $1,486 | $125,250 | $0 | $0 |
| 2014 | $1,297 | $108,125 | $0 | $0 |
Source: Public Records
Map
Nearby Homes
- 809 Augusta Blvd Unit 809-6
- 805 Augusta Blvd Unit 805-6
- 705 Augusta Blvd Unit 705-9
- 705 Augusta Blvd Unit 705-4
- 705 Augusta Blvd Unit 10
- 940 Augusta Blvd Unit 940
- 940 Augusta Blvd Unit D-939
- 760 Augusta Blvd Unit 101
- 5773 Gage Ln Unit B101
- 5757 Gage Ln Unit 102
- 601 Augusta Blvd Unit 601-4
- 601 Augusta Blvd Unit 10
- 5825 Rattlesnake Hammock Rd Unit 107
- 575 Augusta Blvd Unit 8
- 5741 Gage Ln Unit 104
- 5725 Gage Ln Unit E301
- 5841 Rattlesnake Hammock Rd Unit 108
- 565 Augusta Blvd Unit 10
- 5857 Rattlesnake Hammock Rd Unit 204
- 809 Augusta Blvd
- 809 Augusta Blvd Unit 809-3
- 809 Augusta Blvd Unit 809-7
- 809 Augusta Blvd Unit 809-2
- 809 Augusta Blvd Unit 8
- 809 Augusta Blvd Unit 7
- 809 Augusta Blvd Unit 6
- 809 Augusta Blvd Unit 5
- 809 Augusta Blvd Unit 2
- 805 Augusta Blvd
- 805 Augusta Blvd Unit 805-2
- 805 Augusta Blvd Unit 8
- 805 Augusta Blvd Unit 7
- 805 Augusta Blvd Unit 6
- 805 Augusta Blvd Unit 5
- 805 Augusta Blvd Unit 1
- 805 Augusta Blvd Unit 2
- 805 Augusta Blvd Unit 3
- 805 Augusta Blvd Unit 4
Your Personal Tour Guide
Ask me questions while you tour the home.