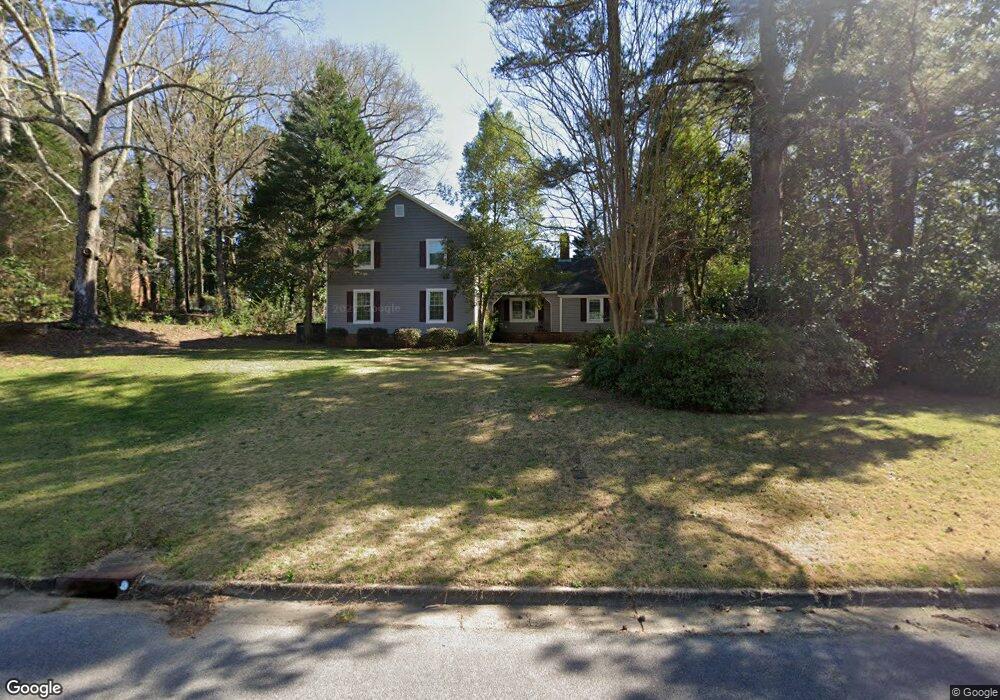
809 Camellia Dr Lagrange, GA 30240
Estimated Value: $376,745 - $459,000
4
Beds
3
Baths
3,268
Sq Ft
$130/Sq Ft
Est. Value
About This Home
This home is located at 809 Camellia Dr, Lagrange, GA 30240 and is currently estimated at $423,686, approximately $129 per square foot. 809 Camellia Dr is a home located in Troup County with nearby schools including Hollis Hand Elementary School, Franklin Forest Elementary School, and Ethel W. Kight Elementary School.
Ownership History
Date
Name
Owned For
Owner Type
Purchase Details
Closed on
Dec 30, 2011
Bought by
Hersey Edwin L
Current Estimated Value
Purchase Details
Closed on
Jun 7, 2011
Sold by
Ocwen Loan Servicing
Bought by
Federal Home Loan
Purchase Details
Closed on
Oct 30, 1997
Sold by
Thomas A Bushar
Bought by
Chadwick Brian S and Chadwick Dianne
Purchase Details
Closed on
May 6, 1991
Sold by
Thomas A Bushar
Bought by
Thomas A Bushar
Purchase Details
Closed on
Aug 29, 1983
Sold by
Sylvia Wayne and Sylvia Hunter
Bought by
Thomas A Bushar
Purchase Details
Closed on
Nov 19, 1974
Sold by
Daniel
Bought by
Sylvia Wayne and Sylvia Hunter
Purchase Details
Closed on
Jan 1, 1972
Sold by
Robt W Christain
Bought by
Daniel
Create a Home Valuation Report for This Property
The Home Valuation Report is an in-depth analysis detailing your home's value as well as a comparison with similar homes in the area
Purchase History
| Date | Buyer | Sale Price | Title Company |
|---|---|---|---|
| Hersey Edwin L | $145,000 | -- | |
| Federal Home Loan | $169,600 | -- | |
| Ocwen Loan Servicing | $169,600 | -- | |
| Chadwick Brian S | $228,500 | -- | |
| Thomas A Bushar | -- | -- | |
| Thomas A Bushar | $151,000 | -- | |
| Sylvia Wayne | -- | -- | |
| Daniel | -- | -- |
Source: Public Records
Tax History Compared to Growth
Tax History
| Year | Tax Paid | Tax Assessment Tax Assessment Total Assessment is a certain percentage of the fair market value that is determined by local assessors to be the total taxable value of land and additions on the property. | Land | Improvement |
|---|---|---|---|---|
| 2025 | $3,067 | $153,792 | $18,000 | $135,792 |
| 2024 | $3,067 | $114,444 | $16,000 | $98,444 |
| 2023 | $2,917 | $108,928 | $16,000 | $92,928 |
| 2022 | $2,811 | $102,688 | $16,000 | $86,688 |
| 2021 | $2,457 | $83,440 | $16,000 | $67,440 |
| 2020 | $2,457 | $83,440 | $16,000 | $67,440 |
| 2019 | $2,592 | $87,920 | $16,000 | $71,920 |
| 2018 | $2,489 | $84,520 | $16,000 | $68,520 |
| 2017 | $2,429 | $82,520 | $16,000 | $66,520 |
| 2016 | $2,474 | $84,000 | $16,000 | $68,000 |
| 2015 | $2,478 | $84,000 | $16,000 | $68,000 |
| 2014 | $2,539 | $90,718 | $16,000 | $74,718 |
| 2013 | -- | $92,400 | $16,000 | $76,400 |
Source: Public Records
Map
Nearby Homes
- 804 Wisteria Way
- 203 S Chilton Crescent
- 201 S Chilton Crescent
- 732 Camellia Dr
- 724 Camellia Dr
- 106 Ewing St
- 100 Creekside Dr Unit LOT 60A
- 204 Dixie Creek Dr
- 204 Colonial St
- 110 Russell St
- 900 North St
- 109 Thomas St
- 104 Sweetgum Dr
- 705 Piney Woods Dr
- 806 New Franklin Rd
- 603 Country Club Rd
- 219 Banks St
- 114 Briarcliff Rd
- 609 Cherokee Rd
- 105 Saynor Cir
- 807 Camellia Dr
- 808 Wisteria Way
- 811 Camellia Dr
- 806 Wisteria Way
- 808 Camellia Dr
- 810 Camellia Dr Unit 182
- 810 Camellia Dr
- 812 Camellia Dr
- 806 Camellia Dr
- 807 Wisteria Way
- 809 Wisteria Way
- 816 Wisteria Way
- 803 Camellia Dr
- 804 Camellia Dr
- 814 Camellia Dr
- 805 Wisteria Way
- 811 Wisteria Way
- 802 Wisteria Way
- 209 Chesterfield Place
- 802 Camellia Dr