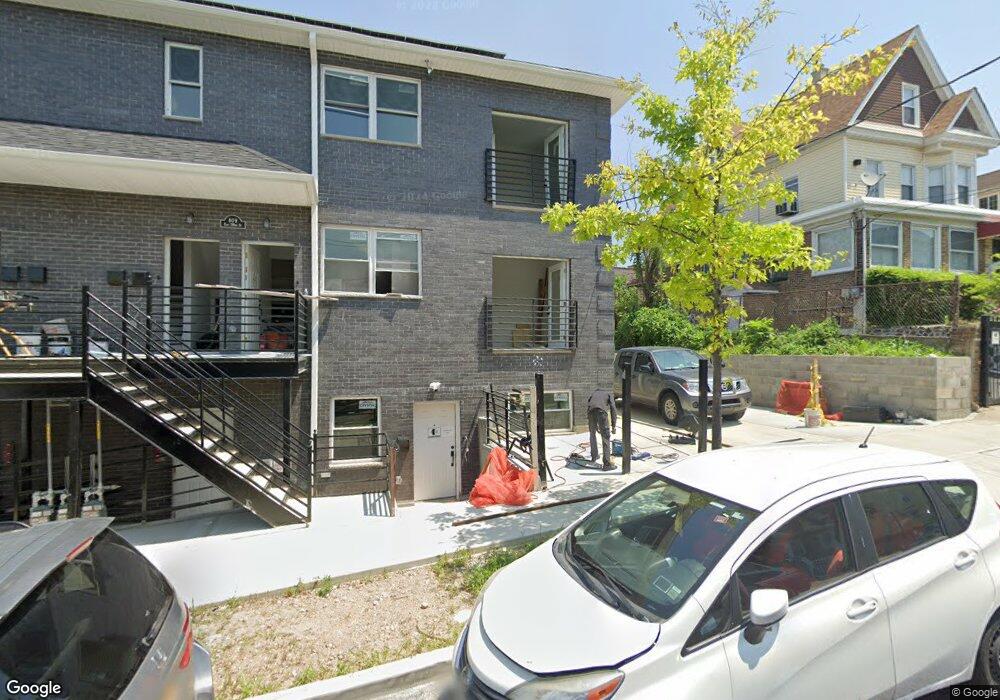
809 E 218th St Bronx, NY 10467
Williamsbridge NeighborhoodEstimated Value: $1,009,000 - $1,220,000
12
Beds
6
Baths
3,771
Sq Ft
$290/Sq Ft
Est. Value
About This Home
This home is located at 809 E 218th St, Bronx, NY 10467 and is currently estimated at $1,093,291, approximately $289 per square foot. 809 E 218th St is a home located in Bronx County with nearby schools including P.S. 78 Anne Hutchinson, North Bronx School of Empowerment, and Girls Preparatory Charter School of the Bronx II.
Ownership History
Date
Name
Owned For
Owner Type
Purchase Details
Closed on
Jul 17, 2024
Sold by
3750 Barnes Development Llc
Bought by
809 E 218 Llc
Current Estimated Value
Purchase Details
Closed on
Jan 7, 2019
Sold by
Greater New York Corporation Of Seventh- and Adventists
Bought by
3750 Barnes Development Llc
Purchase Details
Closed on
Jan 8, 2016
Sold by
Sagi Inc
Bought by
Greater New York Corporation Of
Purchase Details
Closed on
May 4, 2011
Sold by
Top Dvlp Inc
Bought by
Sagi Inc
Purchase Details
Closed on
Oct 23, 2006
Sold by
Russell Cornelia
Bought by
Top Dvlp Inc
Purchase Details
Closed on
Mar 23, 1999
Sold by
Russell Alfred and Russell Cornelia
Bought by
Russell Cornelia
Home Financials for this Owner
Home Financials are based on the most recent Mortgage that was taken out on this home.
Original Mortgage
$145,000
Interest Rate
7.22%
Mortgage Type
Purchase Money Mortgage
Create a Home Valuation Report for This Property
The Home Valuation Report is an in-depth analysis detailing your home's value as well as a comparison with similar homes in the area
Home Values in the Area
Average Home Value in this Area
Purchase History
| Date | Buyer | Sale Price | Title Company |
|---|---|---|---|
| 809 E 218 Llc | $972,575 | -- | |
| 3750 Barnes Development Llc | $425,000 | -- | |
| 3750 Barnes Development Llc | $425,000 | -- | |
| Greater New York Corporation Of | $397,500 | -- | |
| Greater New York Corporation Of | $397,500 | -- | |
| Sagi Inc | $825,626 | -- | |
| Sagi Inc | $825,626 | -- | |
| Top Dvlp Inc | $705,000 | -- | |
| Top Dvlp Inc | $705,000 | -- | |
| Russell Cornelia | -- | Stewart Title Insurance Co | |
| Russell Cornelia | -- | Stewart Title Insurance Co |
Source: Public Records
Mortgage History
| Date | Status | Borrower | Loan Amount |
|---|---|---|---|
| Previous Owner | Russell Cornelia | $145,000 |
Source: Public Records
Tax History
| Year | Tax Paid | Tax Assessment Tax Assessment Total Assessment is a certain percentage of the fair market value that is determined by local assessors to be the total taxable value of land and additions on the property. | Land | Improvement |
|---|---|---|---|---|
| 2025 | $10,495 | $54,540 | $14,015 | $40,525 |
| 2024 | $10,495 | $52,255 | $13,255 | $39,000 |
| 2023 | $2,540 | $12,505 | $12,505 | $0 |
| 2022 | $2,103 | $13,800 | $13,800 | $0 |
| 2021 | $0 | $27,540 | $27,540 | $0 |
| 2020 | $4,666 | $23,940 | $23,940 | $0 |
| 2019 | $4,205 | $20,820 | $20,820 | $0 |
| 2018 | $4,000 | $19,620 | $19,620 | $0 |
| 2017 | $4,709 | $23,100 | $23,100 | $0 |
| 2016 | $4,615 | $23,085 | $23,085 | $0 |
| 2015 | $2,949 | $24,268 | $24,268 | $0 |
| 2014 | $2,949 | $22,896 | $22,896 | $0 |
Source: Public Records
Map
Nearby Homes
- 3763 Barnes Ave
- 811 E 219th St
- 738 E 219th St
- 740 E 218th St
- 762 E 221st St
- 804 E 221st St
- 724 E 216th St Unit 5C
- 724 E 216th St Unit 2C
- 724 E 216th St Unit 4D
- 831 E 221st St
- 835 E 221st St
- 849 E 221st St
- 3717 Bronxwood Ave
- 3800 Bronxwood Ave
- 822 E 215th St
- 865 E 215th St
- 732 E 223rd St
- 679 E 221st St
- 927 E 219th St
- 3662 Bronxwood Ave
- 3750 Barnes Ave
- 3756 Barnes Ave
- 803 E 218th St
- 813 E 218th St
- 3758 Barnes Ave
- 3758 Barnes Ave Unit 2
- 3758 Barnes Ave Unit 4
- 3760 Barnes Ave
- 815 E 218th St
- 815 E 218th St Unit 2
- 815 E 218th St Unit 4
- 819 E 218th St
- 819 E 218th St Unit 3R
- 819 E 218th St Unit 2
- 819 E 218th St Unit 4
- 3762 Barnes Ave
- 3764 Barnes Ave
- 0 E 218th St Unit 3310337
- 3766 Barnes Ave
- 808 E 218th St
Your Personal Tour Guide
Ask me questions while you tour the home.