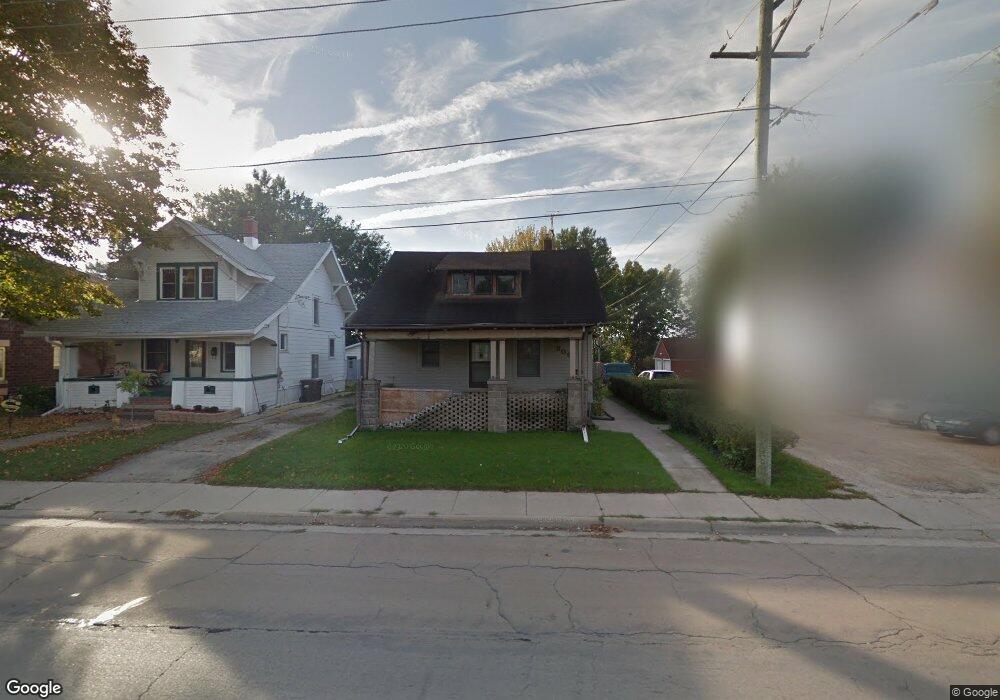
809 E 2nd St Sterling, IL 61081
Estimated Value: $55,000 - $84,000
2
Beds
--
Bath
1,103
Sq Ft
$65/Sq Ft
Est. Value
About This Home
This home is located at 809 E 2nd St, Sterling, IL 61081 and is currently estimated at $71,249, approximately $64 per square foot. 809 E 2nd St is a home located in Whiteside County with nearby schools including St. Mary's School.
Ownership History
Date
Name
Owned For
Owner Type
Purchase Details
Closed on
Dec 1, 2023
Sold by
Patch Properties Llc
Bought by
Burrow Gage
Current Estimated Value
Home Financials for this Owner
Home Financials are based on the most recent Mortgage that was taken out on this home.
Original Mortgage
$73,150
Outstanding Balance
$71,936
Interest Rate
7.5%
Mortgage Type
New Conventional
Estimated Equity
-$687
Purchase Details
Closed on
May 16, 2022
Sold by
Charlene Nysather
Bought by
Patch Properties Llc
Purchase Details
Closed on
Mar 4, 2019
Sold by
Nysather Rodney A and Nysather Charlene J
Bought by
Nysather Rodney A and Nysather Charlene J
Create a Home Valuation Report for This Property
The Home Valuation Report is an in-depth analysis detailing your home's value as well as a comparison with similar homes in the area
Home Values in the Area
Average Home Value in this Area
Purchase History
| Date | Buyer | Sale Price | Title Company |
|---|---|---|---|
| Burrow Gage | $77,000 | None Listed On Document | |
| Patch Properties Llc | $38,000 | Pace & Johnson Pc | |
| Nysather Rodney A | -- | -- |
Source: Public Records
Mortgage History
| Date | Status | Borrower | Loan Amount |
|---|---|---|---|
| Open | Burrow Gage | $73,150 |
Source: Public Records
Tax History
| Year | Tax Paid | Tax Assessment Tax Assessment Total Assessment is a certain percentage of the fair market value that is determined by local assessors to be the total taxable value of land and additions on the property. | Land | Improvement |
|---|---|---|---|---|
| 2024 | $845 | $14,101 | $3,850 | $10,251 |
| 2023 | $1,388 | $13,237 | $3,614 | $9,623 |
| 2022 | $1,742 | $22,307 | $3,458 | $18,849 |
| 2021 | $1,644 | $21,036 | $3,261 | $17,775 |
| 2020 | $1,575 | $20,299 | $3,147 | $17,152 |
| 2019 | $1,553 | $19,930 | $3,090 | $16,840 |
| 2018 | $1,385 | $19,962 | $3,095 | $16,867 |
| 2017 | $1,383 | $18,454 | $3,074 | $15,380 |
| 2016 | $1,327 | $17,859 | $2,975 | $14,884 |
| 2015 | $129 | $18,348 | $3,056 | $15,292 |
| 2014 | $1,269 | $17,941 | $2,988 | $14,953 |
| 2013 | $129 | $18,348 | $3,056 | $15,292 |
Source: Public Records
Map
Nearby Homes
Your Personal Tour Guide
Ask me questions while you tour the home.