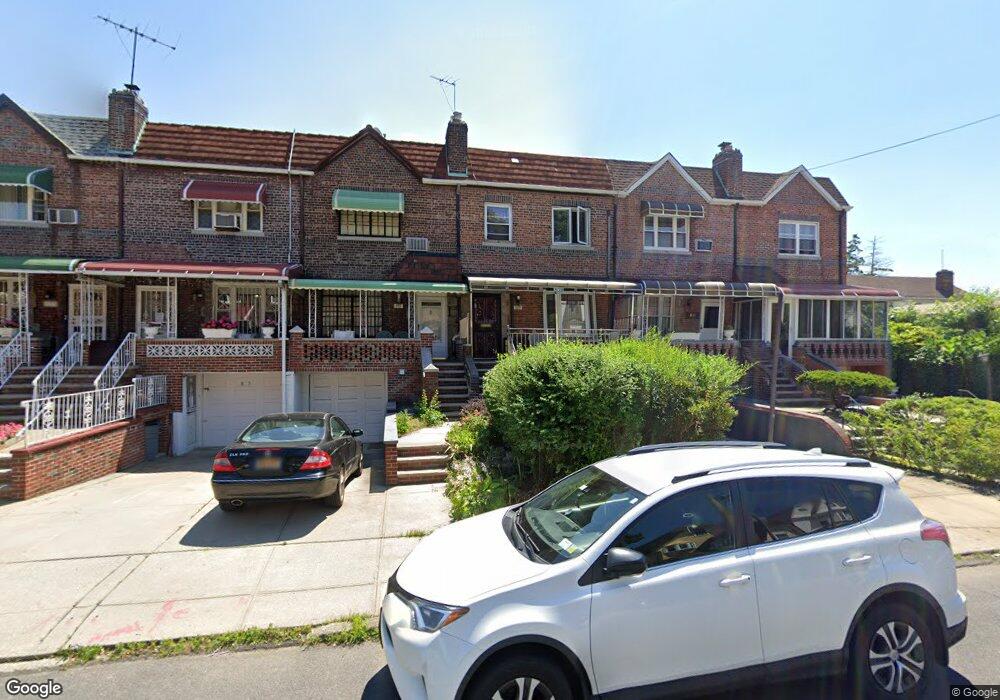
809 E 39th St Brooklyn, NY 11210
East Flatbush NeighborhoodEstimated Value: $722,000 - $848,000
Studio
--
Bath
1,710
Sq Ft
$459/Sq Ft
Est. Value
About This Home
This home is located at 809 E 39th St, Brooklyn, NY 11210 and is currently estimated at $785,527, approximately $459 per square foot. 809 E 39th St is a home located in Kings County with nearby schools including P.S. 198 Brooklyn, Andries Hudde School, and Central Brooklyn Ascend Charter.
Ownership History
Date
Name
Owned For
Owner Type
Purchase Details
Closed on
Mar 9, 2006
Sold by
Mulgrave Audley
Bought by
Frank and Denise
Current Estimated Value
Home Financials for this Owner
Home Financials are based on the most recent Mortgage that was taken out on this home.
Original Mortgage
$413,250
Outstanding Balance
$229,736
Interest Rate
6.28%
Mortgage Type
Purchase Money Mortgage
Estimated Equity
$555,791
Purchase Details
Closed on
Aug 20, 2005
Sold by
Mulgrave Audley
Bought by
Mulgrave Audley
Purchase Details
Closed on
Sep 10, 2002
Sold by
Davis Pauline
Bought by
Mulgrave Pauline Davis and Mulgrave Audley
Home Financials for this Owner
Home Financials are based on the most recent Mortgage that was taken out on this home.
Original Mortgage
$205,867
Interest Rate
6.09%
Mortgage Type
Purchase Money Mortgage
Purchase Details
Closed on
Dec 18, 1998
Sold by
Davis Pauline and Pearce Evelyn
Bought by
Davis Pauline
Create a Home Valuation Report for This Property
The Home Valuation Report is an in-depth analysis detailing your home's value as well as a comparison with similar homes in the area
Home Values in the Area
Average Home Value in this Area
Purchase History
| Date | Buyer | Sale Price | Title Company |
|---|---|---|---|
| Frank | $435,000 | -- | |
| Frank | $435,000 | -- | |
| Mulgrave Audley | -- | -- | |
| Mulgrave Audley | -- | -- | |
| Mulgrave Pauline Davis | -- | -- | |
| Mulgrave Pauline Davis | -- | -- | |
| Davis Pauline | -- | Chicago Title Insurance Co | |
| Davis Pauline | -- | Chicago Title Insurance Co |
Source: Public Records
Mortgage History
| Date | Status | Borrower | Loan Amount |
|---|---|---|---|
| Open | Frank | $413,250 | |
| Closed | Frank | $413,250 | |
| Previous Owner | Mulgrave Pauline Davis | $205,867 |
Source: Public Records
Tax History
| Year | Tax Paid | Tax Assessment Tax Assessment Total Assessment is a certain percentage of the fair market value that is determined by local assessors to be the total taxable value of land and additions on the property. | Land | Improvement |
|---|---|---|---|---|
| 2025 | $6,427 | $43,200 | $12,960 | $30,240 |
| 2024 | $6,427 | $36,840 | $12,960 | $23,880 |
| 2023 | $6,132 | $41,100 | $12,960 | $28,140 |
| 2022 | $5,686 | $35,640 | $12,960 | $22,680 |
| 2021 | $5,655 | $37,020 | $12,960 | $24,060 |
| 2020 | $2,811 | $33,480 | $12,960 | $20,520 |
| 2019 | $5,578 | $33,480 | $12,960 | $20,520 |
| 2018 | $5,129 | $25,159 | $11,917 | $13,242 |
| 2017 | $4,839 | $23,736 | $11,868 | $11,868 |
| 2016 | $4,477 | $22,394 | $11,684 | $10,710 |
| 2015 | $2,481 | $22,394 | $14,332 | $8,062 |
| 2014 | $2,481 | $22,222 | $13,234 | $8,988 |
Source: Public Records
Map
Nearby Homes
- 712 E 40th St
- 850 E 39th St
- 881 E 39th St
- 680 E 42nd St
- 677 E 38th St
- 788 E 37th St
- 1513 Brooklyn Ave
- 720 Brooklyn Ave Unit 5K
- 659 E 43rd St
- 3816 Glenwood Rd
- 1390 Troy Ave
- 627 E 42nd St
- 1359 Albany Ave
- 620 E 38th St
- 1558 Brooklyn Ave
- 1352 Troy Ave
- 720 E 35th St
- 655 E 39th St
- 785 E 34th St Unit 3-C
- 3906 Avenue D
Your Personal Tour Guide
Ask me questions while you tour the home.