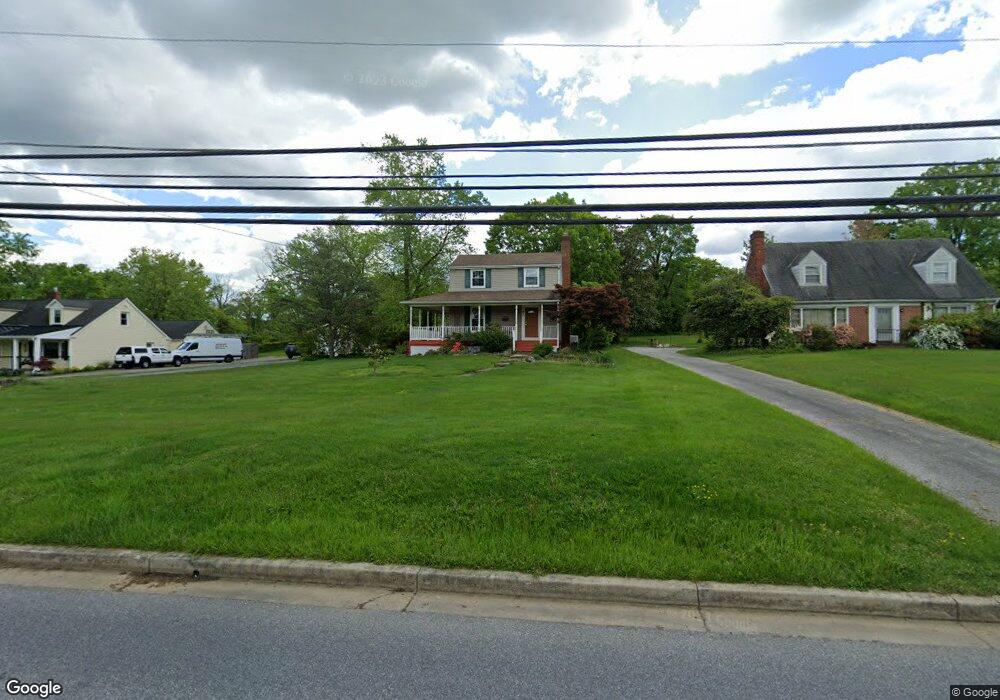
809 Francis Ave Halethorpe, MD 21227
Estimated Value: $549,000 - $597,000
Studio
2
Baths
1,950
Sq Ft
$294/Sq Ft
Est. Value
About This Home
This home is located at 809 Francis Ave, Halethorpe, MD 21227 and is currently estimated at $573,845, approximately $294 per square foot. 809 Francis Ave is a home located in Baltimore County with nearby schools including Relay Elementary School, Arbutus Middle School, and Lansdowne High School.
Ownership History
Date
Name
Owned For
Owner Type
Purchase Details
Closed on
Jul 20, 2006
Sold by
Montelius Richard B
Bought by
Givens Jason M and Moeller Ditte
Current Estimated Value
Home Financials for this Owner
Home Financials are based on the most recent Mortgage that was taken out on this home.
Original Mortgage
$384,998
Outstanding Balance
$228,816
Interest Rate
6.67%
Mortgage Type
Purchase Money Mortgage
Estimated Equity
$345,029
Purchase Details
Closed on
Jul 13, 2006
Sold by
Montelius Richard B
Bought by
Givens Jason M and Moeller Ditte
Home Financials for this Owner
Home Financials are based on the most recent Mortgage that was taken out on this home.
Original Mortgage
$384,998
Outstanding Balance
$228,816
Interest Rate
6.67%
Mortgage Type
Purchase Money Mortgage
Estimated Equity
$345,029
Purchase Details
Closed on
Jan 6, 2000
Sold by
Flaim David
Bought by
Montelius Richard B and Montelius Denise J M
Purchase Details
Closed on
Jul 30, 1997
Sold by
Hanna Robert W
Bought by
Flaim David and Flaim Geralyn D
Create a Home Valuation Report for This Property
The Home Valuation Report is an in-depth analysis detailing your home's value as well as a comparison with similar homes in the area
Home Values in the Area
Average Home Value in this Area
Purchase History
We collect this data history from publicly available records. To have your information removed, we recommend requesting removal directly through your county’s website.
| Date | Buyer | Sale Price | Title Company |
|---|---|---|---|
| Givens Jason M | $499,998 | -- | |
| Givens Jason M | $499,998 | -- | |
| Montelius Richard B | $142,500 | -- | |
| Flaim David | $138,000 | -- |
Source: Public Records
Mortgage History
We collect this data history from publicly available records. To have your information removed, we recommend requesting removal directly through your county’s website.
| Date | Status | Borrower | Loan Amount |
|---|---|---|---|
| Open | Givens Jason M | $384,998 | |
| Closed | Givens Jason M | $384,998 |
Source: Public Records
Tax History
| Year | Tax Paid | Tax Assessment Tax Assessment Total Assessment is a certain percentage of the fair market value that is determined by local assessors to be the total taxable value of land and additions on the property. | Land | Improvement |
|---|---|---|---|---|
| 2025 | $5,646 | $430,633 | -- | -- |
| 2024 | $5,646 | $390,000 | $89,100 | $300,900 |
| 2023 | $2,808 | $381,133 | $0 | $0 |
| 2022 | $5,410 | $372,267 | $0 | $0 |
| 2021 | $5,144 | $363,400 | $89,100 | $274,300 |
| 2020 | $5,144 | $357,800 | $0 | $0 |
| 2019 | $4,990 | $352,200 | $0 | $0 |
| 2018 | $4,830 | $346,600 | $89,100 | $257,500 |
| 2017 | $4,471 | $332,133 | $0 | $0 |
| 2016 | $4,185 | $317,667 | $0 | $0 |
| 2015 | $4,185 | $303,200 | $0 | $0 |
| 2014 | $4,185 | $303,200 | $0 | $0 |
Source: Public Records
Map
Nearby Homes
- 25 W W End Ct
- 2 Fallen Tree Ct Unit 2A
- 2 Fallen Tree Ct Unit 2H
- 19 Piedmont Ct
- 711 Woodland Dr
- 10 Fallen Tree Ct Unit D
- 5816 Richardson Mews Square
- 4948 Tulip Ave
- 5827 Richardson Mews Square
- 5630 Ringwood Dr Unit E
- 1121 Kelfield Dr
- 18 Ingate Terrace
- 5824 Oakland Rd
- 1057 Elm Rd
- 5630 Oakland Rd
- 5611 Chelwynd Rd
- 1126 Elm Rd
- 1823 Mayfield Ave
- 6044 Old Lawyers Hill Rd
- 1712 Selma Ave
- 807 Francis Ave
- 811 Francis Ave
- 805 Francis Ave
- 815 Francis Ave
- 817 Francis Ave
- 803 Francis Ave
- 808 Francis Ave
- 810 Francis Ave
- 812 Francis Ave
- 801 Francis Ave
- 800 Francis Ave
- 814 Francis Ave
- 821 Francis Ave
- 816 Francis Ave
- 1549 S Rolling Rd
- 1601 S Rolling Rd
- 1547 S Rolling Rd
- 818 Francis Ave
- 4 Le Grand Ct
- 1543 S Rolling Rd
Your Personal Tour Guide
Ask me questions while you tour the home.