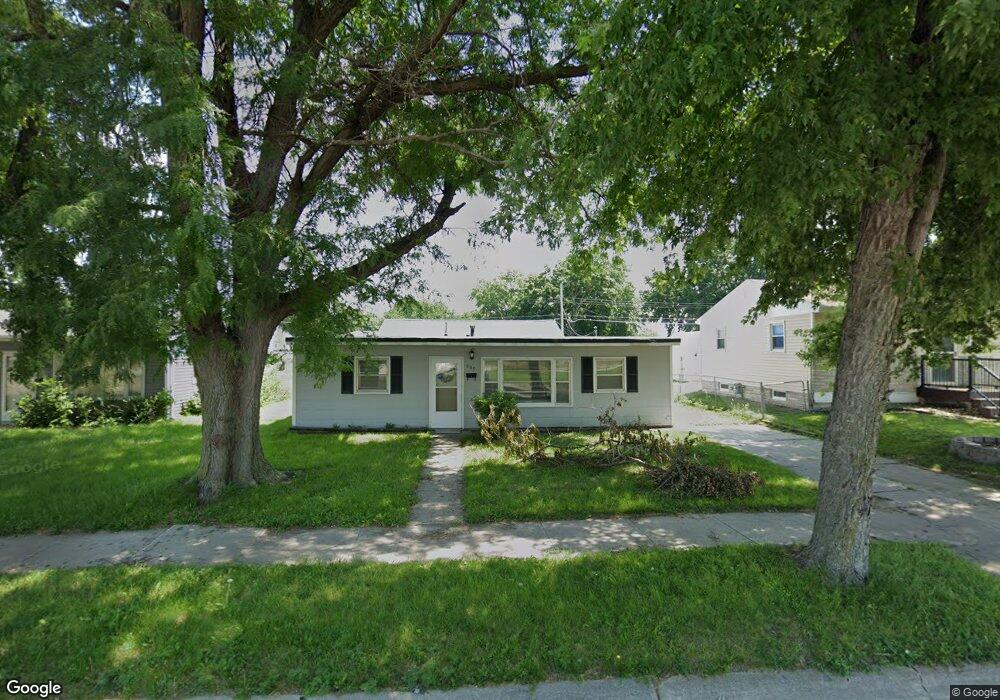
809 Glenn St Norfolk, NE 68701
Estimated Value: $122,000 - $175,703
2
Beds
1
Bath
864
Sq Ft
$174/Sq Ft
Est. Value
About This Home
This home is located at 809 Glenn St, Norfolk, NE 68701 and is currently estimated at $149,926, approximately $173 per square foot. 809 Glenn St is a home located in Madison County with nearby schools including Norfolk Senior High School, Christ Lutheran School, and Keystone Christian Academy.
Ownership History
Date
Name
Owned For
Owner Type
Purchase Details
Closed on
Oct 15, 2021
Sold by
Braun Matthew R
Bought by
Neidig James T
Current Estimated Value
Home Financials for this Owner
Home Financials are based on the most recent Mortgage that was taken out on this home.
Original Mortgage
$100,000
Outstanding Balance
$91,100
Interest Rate
2.88%
Mortgage Type
New Conventional
Estimated Equity
$58,826
Purchase Details
Closed on
Mar 15, 2005
Sold by
Sokol Kevin J
Bought by
Braun Matthew R
Home Financials for this Owner
Home Financials are based on the most recent Mortgage that was taken out on this home.
Original Mortgage
$4,000
Interest Rate
5.71%
Mortgage Type
Stand Alone Second
Purchase Details
Closed on
Feb 11, 2005
Sold by
Sokol Kevin J and Sokol Joette
Bought by
Braun Matthew R
Home Financials for this Owner
Home Financials are based on the most recent Mortgage that was taken out on this home.
Original Mortgage
$4,000
Interest Rate
5.71%
Mortgage Type
Stand Alone Second
Create a Home Valuation Report for This Property
The Home Valuation Report is an in-depth analysis detailing your home's value as well as a comparison with similar homes in the area
Home Values in the Area
Average Home Value in this Area
Purchase History
| Date | Buyer | Sale Price | Title Company |
|---|---|---|---|
| Neidig James T | $95,000 | Ne Ne Title & Escrow | |
| Braun Matthew R | $53,000 | -- | |
| Braun Matthew R | $53,000 | Rels Title |
Source: Public Records
Mortgage History
| Date | Status | Borrower | Loan Amount |
|---|---|---|---|
| Open | Neidig James T | $100,000 | |
| Previous Owner | Braun Matthew R | $4,000 | |
| Previous Owner | Braun Matthew R | $47,700 |
Source: Public Records
Tax History Compared to Growth
Tax History
| Year | Tax Paid | Tax Assessment Tax Assessment Total Assessment is a certain percentage of the fair market value that is determined by local assessors to be the total taxable value of land and additions on the property. | Land | Improvement |
|---|---|---|---|---|
| 2024 | $1,532 | $122,801 | $8,630 | $114,171 |
| 2023 | $2,044 | $110,568 | $8,630 | $101,938 |
| 2022 | $1,847 | $99,646 | $8,630 | $91,016 |
| 2021 | $1,663 | $89,894 | $8,630 | $81,264 |
| 2020 | $1,497 | $81,187 | $8,630 | $72,557 |
| 2019 | $1,402 | $73,413 | $8,630 | $64,783 |
| 2018 | $1,216 | $64,746 | $6,904 | $57,842 |
| 2017 | $1,128 | $59,970 | $6,904 | $53,066 |
| 2016 | $1,009 | $53,544 | $6,164 | $47,380 |
| 2015 | $1,009 | $53,544 | $6,164 | $47,380 |
| 2014 | $1,039 | $53,544 | $6,164 | $47,380 |
| 2013 | $1,011 | $50,444 | $6,164 | $44,280 |
Source: Public Records
Map
Nearby Homes
- 3307 W Michigan Ave
- 3206 W Michigan Ave
- 3205 W Michigan Ave
- 3306 W Michigan Ave
- 706 Columbia St
- 1104 Southern Dr
- 103 S 13th Place
- 809 S 14th St
- 705 S 10th St
- 602 S 10th St
- 404 S 12th St
- 1312 Hayes Ave
- 2300 Taylor Ave
- 2308 Taylor Ave
- 1313 W Park Ave
- See Legal
- 918 S 5th St
- 1208 W Phillip Ave
- 1809 W Taylor Ave
- 805 S 5th St