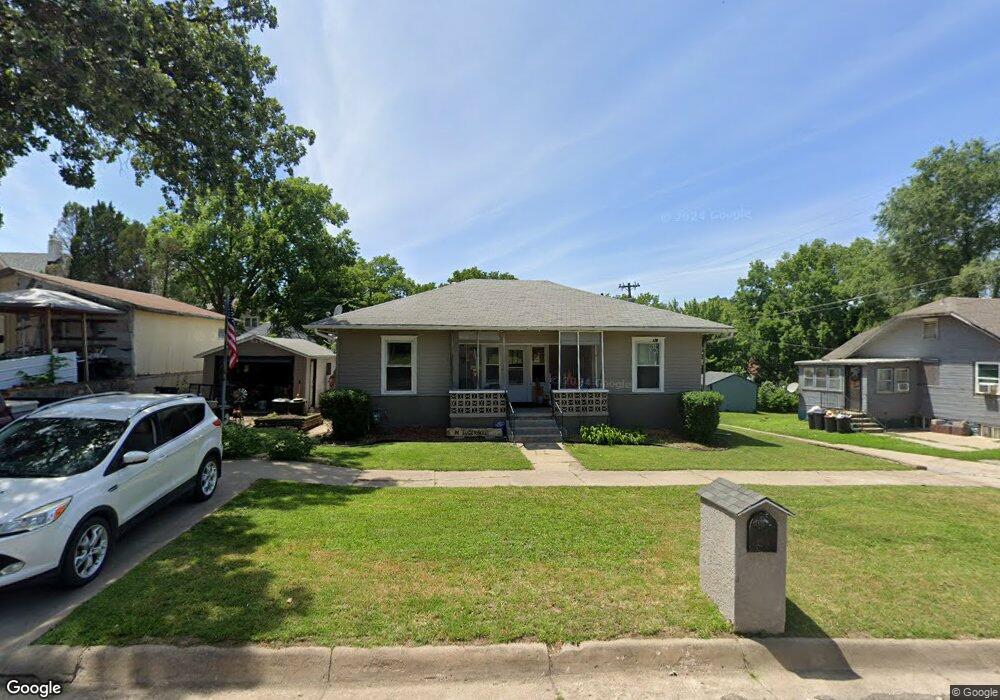
809 I St Fairbury, NE 68352
Estimated Value: $77,000 - $124,000
2
Beds
2
Baths
979
Sq Ft
$102/Sq Ft
Est. Value
About This Home
This home is located at 809 I St, Fairbury, NE 68352 and is currently estimated at $99,759, approximately $101 per square foot. 809 I St is a home located in Jefferson County with nearby schools including Central Elementary School, Jefferson Intermediate School, and Fairbury Junior/Senior High School.
Ownership History
Date
Name
Owned For
Owner Type
Purchase Details
Closed on
Sep 20, 2023
Sold by
Lugenbeel James A
Bought by
Lugenbeel James A and Lugenbeel Jesse A
Current Estimated Value
Purchase Details
Closed on
Sep 15, 2012
Sold by
Gary Aa Gary Aa
Bought by
Lugenbeel James A and Lugenbeel Sharon K
Create a Home Valuation Report for This Property
The Home Valuation Report is an in-depth analysis detailing your home's value as well as a comparison with similar homes in the area
Home Values in the Area
Average Home Value in this Area
Purchase History
| Date | Buyer | Sale Price | Title Company |
|---|---|---|---|
| Lugenbeel James A | -- | None Listed On Document | |
| Lugenbeel James A | -- | None Listed On Document | |
| Lugenbeel James A | -- | -- |
Source: Public Records
Tax History Compared to Growth
Tax History
| Year | Tax Paid | Tax Assessment Tax Assessment Total Assessment is a certain percentage of the fair market value that is determined by local assessors to be the total taxable value of land and additions on the property. | Land | Improvement |
|---|---|---|---|---|
| 2024 | $952 | $65,117 | $4,675 | $60,442 |
| 2023 | $0 | $39,417 | $1,272 | $38,145 |
| 2022 | $882 | $39,417 | $1,272 | $38,145 |
| 2021 | $895 | $38,899 | $1,272 | $37,627 |
| 2020 | $818 | $34,885 | $1,272 | $33,613 |
| 2019 | $808 | $34,885 | $1,272 | $33,613 |
| 2018 | $661 | $28,882 | $1,272 | $27,610 |
| 2017 | $655 | $29,365 | $1,270 | $28,095 |
| 2016 | $608 | $29,365 | $1,270 | $28,095 |
| 2015 | $606 | $29,706 | $1,261 | $28,445 |
| 2014 | $613 | $29,706 | $1,261 | $28,445 |
| 2013 | $657 | $29,706 | $1,261 | $28,445 |
Source: Public Records
Map
Nearby Homes