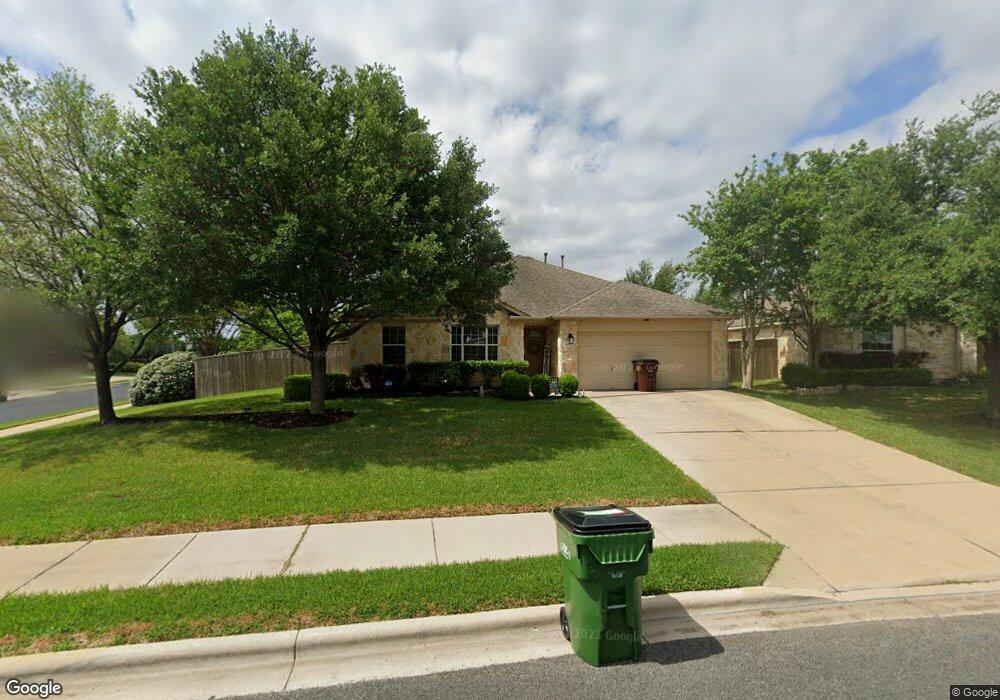
809 Meadow Bluff Ct Round Rock, TX 78665
Teravista NeighborhoodEstimated Value: $365,749 - $391,000
3
Beds
2
Baths
1,705
Sq Ft
$221/Sq Ft
Est. Value
About This Home
This home is located at 809 Meadow Bluff Ct, Round Rock, TX 78665 and is currently estimated at $377,437, approximately $221 per square foot. 809 Meadow Bluff Ct is a home located in Williamson County with nearby schools including Teravista Elementary Leadership Academy, Hopewell Middle School, and Stony Point High IB World School.
Ownership History
Date
Name
Owned For
Owner Type
Purchase Details
Closed on
Jul 7, 2010
Sold by
Kunce Fawn Marie and Huskins Patrick James
Bought by
Kerr Angela D
Current Estimated Value
Home Financials for this Owner
Home Financials are based on the most recent Mortgage that was taken out on this home.
Original Mortgage
$141,900
Outstanding Balance
$94,530
Interest Rate
4.77%
Mortgage Type
New Conventional
Estimated Equity
$282,907
Purchase Details
Closed on
Sep 29, 2006
Sold by
Lennar Homes Of Texas Sales & Mktg Ltd
Bought by
Kunce Fawn Marie and Huskins Patrick James
Home Financials for this Owner
Home Financials are based on the most recent Mortgage that was taken out on this home.
Original Mortgage
$168,337
Interest Rate
6.44%
Mortgage Type
FHA
Purchase Details
Closed on
Jun 2, 2006
Sold by
Nnp Teravista Lp
Bought by
Lennar Homes Of Texas Land & Const Ltd
Create a Home Valuation Report for This Property
The Home Valuation Report is an in-depth analysis detailing your home's value as well as a comparison with similar homes in the area
Home Values in the Area
Average Home Value in this Area
Purchase History
| Date | Buyer | Sale Price | Title Company |
|---|---|---|---|
| Kerr Angela D | -- | Independence Title Company | |
| Kunce Fawn Marie | -- | North American Title | |
| Lennar Homes Of Texas Sales & Mktg Ltd | -- | North American Title | |
| Lennar Homes Of Texas Land & Const Ltd | -- | North American Title |
Source: Public Records
Mortgage History
| Date | Status | Borrower | Loan Amount |
|---|---|---|---|
| Open | Kerr Angela D | $141,900 | |
| Previous Owner | Lennar Homes Of Texas Sales & Mktg Ltd | $168,337 |
Source: Public Records
Tax History Compared to Growth
Tax History
| Year | Tax Paid | Tax Assessment Tax Assessment Total Assessment is a certain percentage of the fair market value that is determined by local assessors to be the total taxable value of land and additions on the property. | Land | Improvement |
|---|---|---|---|---|
| 2025 | $5,695 | $377,460 | $92,000 | $285,460 |
| 2024 | $5,695 | $350,556 | -- | -- |
| 2023 | $5,133 | $318,687 | $0 | $0 |
| 2022 | $6,098 | $289,715 | $0 | $0 |
| 2021 | $6,468 | $263,377 | $72,206 | $225,849 |
| 2020 | $5,910 | $239,434 | $68,696 | $170,738 |
| 2019 | $6,186 | $243,670 | $62,788 | $180,882 |
| 2018 | $5,552 | $231,837 | $62,788 | $169,049 |
| 2017 | $6,043 | $227,981 | $58,680 | $181,950 |
| 2016 | $5,494 | $207,255 | $58,680 | $161,733 |
| 2015 | $4,621 | $188,414 | $48,900 | $157,132 |
| 2014 | $4,621 | $171,285 | $0 | $0 |
Source: Public Records
Map
Nearby Homes
- 802 Meadow Bluff Ct
- 701 Old Ravine Ct
- 716 Bent Wood Place
- 702 Bent Wood Place
- 1001 Winding Creek Place
- 3808 Julianas Way
- 1310 Quicksilver St
- 3807 Haleys Way
- 1104 Stone Slope Ct
- 1420 Quicksilver Cir
- 1307 Terra St
- 4424 Bent Path
- 1319 Ashley Dr
- 3710 Haleys Way
- 915 Satellite View
- 1127 Winding Creek Place
- 1532 Lorson Loop
- 3612 Short Horn Ln
- 3601 Longhorn Trail
- 3725 Birdhouse Dr
- 807 Meadow Bluff Ct
- 810 Broken Trace Ct
- 808 Broken Trace Ct
- 4013 Meadow Bluff Way
- 4015 Meadow Bluff Way
- 4011 Meadow Bluff Way
- 814 Meadow Bluff Ct
- 806 Broken Trace Ct
- 4009 Meadow Bluff Way
- 4017 Meadow Bluff Way
- 804 Broken Trace Ct
- 812 Meadow Bluff Ct
- 803 Meadow Bluff Ct
- 4019 Meadow Bluff Way
- 4007 Meadow Bluff Way
- 810 Meadow Bluff Ct
- 802 Broken Trace Ct
- 801 Meadow Bluff Ct
- 811 Broken Trace Ct
- 4021 Meadow Bluff Way