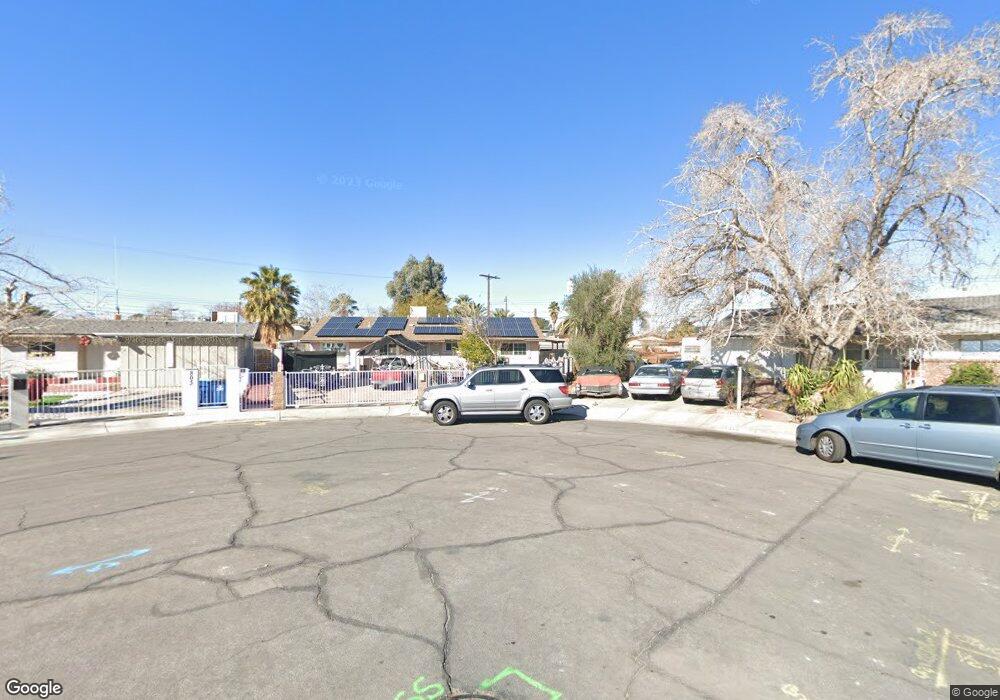
809 N 19th St Las Vegas, NV 89101
Downtown Las Vegas NeighborhoodEstimated Value: $357,000 - $401,000
2
Beds
2
Baths
1,901
Sq Ft
$197/Sq Ft
Est. Value
About This Home
This home is located at 809 N 19th St, Las Vegas, NV 89101 and is currently estimated at $374,764, approximately $197 per square foot. 809 N 19th St is a home located in Clark County with nearby schools including Halle Hewetson Elementary School, J.D. Smith Middle School, and Rancho High School.
Ownership History
Date
Name
Owned For
Owner Type
Purchase Details
Closed on
Dec 11, 2021
Sold by
Vasquez Juan Jose
Bought by
Vasquez Juan Jose and Vasquez Claudia Yaneth
Current Estimated Value
Purchase Details
Closed on
Feb 6, 2012
Sold by
Vasquez Jose
Bought by
Vasquez Juan Jose and The Juan Jose Vasquez Living Trust
Purchase Details
Closed on
Feb 19, 1999
Sold by
Vasquez Juan Jose and Vasquez Estela Olga
Bought by
Vasquez Jose
Home Financials for this Owner
Home Financials are based on the most recent Mortgage that was taken out on this home.
Original Mortgage
$55,000
Interest Rate
6.78%
Purchase Details
Closed on
Feb 9, 1999
Sold by
Vasquez Olga
Bought by
Vasquez Jose
Home Financials for this Owner
Home Financials are based on the most recent Mortgage that was taken out on this home.
Original Mortgage
$55,000
Interest Rate
6.78%
Create a Home Valuation Report for This Property
The Home Valuation Report is an in-depth analysis detailing your home's value as well as a comparison with similar homes in the area
Home Values in the Area
Average Home Value in this Area
Purchase History
| Date | Buyer | Sale Price | Title Company |
|---|---|---|---|
| Vasquez Juan Jose | -- | None Available | |
| Vasquez Juan Jose | -- | None Available | |
| Vasquez Juan Jose | -- | None Available | |
| Vasquez Jose | -- | Land Title | |
| Vasquez Jose | -- | -- |
Source: Public Records
Mortgage History
| Date | Status | Borrower | Loan Amount |
|---|---|---|---|
| Closed | Vasquez Jose | $55,000 |
Source: Public Records
Tax History Compared to Growth
Tax History
| Year | Tax Paid | Tax Assessment Tax Assessment Total Assessment is a certain percentage of the fair market value that is determined by local assessors to be the total taxable value of land and additions on the property. | Land | Improvement |
|---|---|---|---|---|
| 2025 | $1,430 | $57,210 | $25,900 | $31,310 |
| 2024 | $1,325 | $57,210 | $25,900 | $31,310 |
| 2023 | $1,325 | $57,156 | $29,050 | $28,106 |
| 2022 | $1,227 | $48,698 | $23,450 | $25,248 |
| 2021 | $1,136 | $40,964 | $17,500 | $23,464 |
| 2020 | $1,052 | $38,571 | $15,750 | $22,821 |
| 2019 | $986 | $35,962 | $14,000 | $21,962 |
| 2018 | $941 | $33,595 | $12,950 | $20,645 |
| 2017 | $1,058 | $32,263 | $10,500 | $21,763 |
| 2016 | $882 | $31,345 | $8,050 | $23,295 |
| 2015 | $879 | $29,127 | $5,600 | $23,527 |
| 2014 | $852 | $25,210 | $4,200 | $21,010 |
Source: Public Records
Map
Nearby Homes
- 1705 Leslie Ave Unit 1
- 833 N Bruce St
- 828 Held Rd
- 1812 Ryan Ave
- 624 N Bruce St
- 709 N 22nd St
- 629 N 16th St
- 700 N 14th St
- 2020 E Bonanza Rd
- 2005 Jansen Ave
- 921 Delta St
- 1908 Linden Ave
- 2016 Linden Ave
- 507 N 15th St
- 437 N 23rd St
- 920 E Bonanza Rd
- 1915 E Mesquite Ave
- 513 N 13th Bldg A St
- 513 N 13th St
- 416 N 15th St